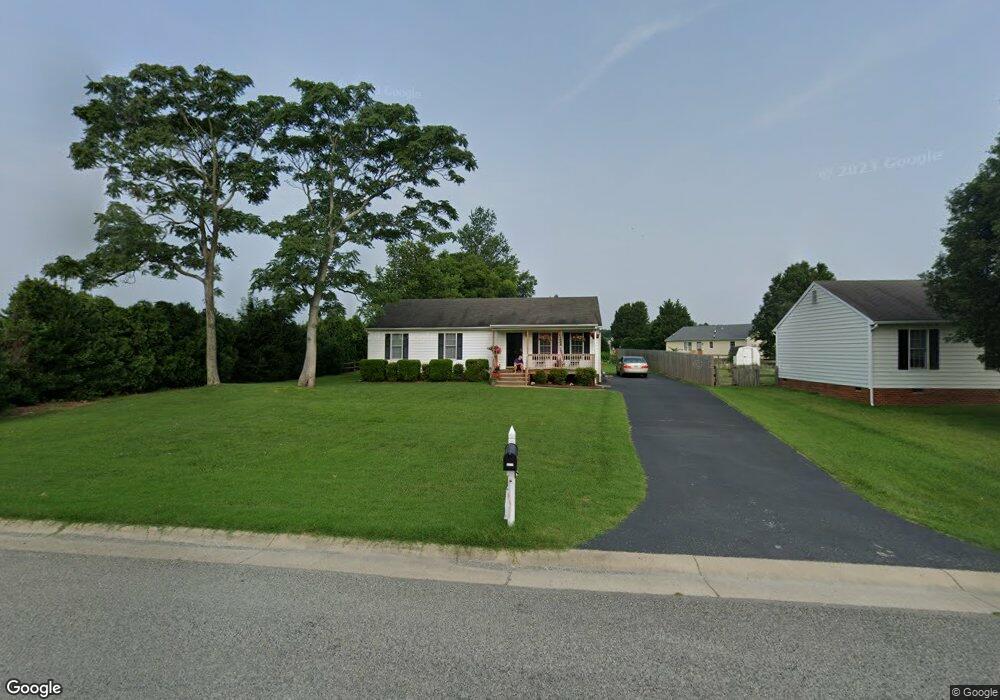
8201 Halycon Ln Mechanicsville, VA 23111
Estimated Value: $351,000 - $367,000
3
Beds
2
Baths
1,364
Sq Ft
$263/Sq Ft
Est. Value
About This Home
This home is located at 8201 Halycon Ln, Mechanicsville, VA 23111 and is currently estimated at $358,470, approximately $262 per square foot. 8201 Halycon Ln is a home located in Hanover County with nearby schools including Laurel Meadow Elementary School, Bell Creek Middle School, and Mechanicsville High School.
Ownership History
Date
Name
Owned For
Owner Type
Purchase Details
Closed on
Jun 9, 2021
Sold by
Harver Lauren E and Mull Lauren Harver
Bought by
Phillips Alfred M
Current Estimated Value
Home Financials for this Owner
Home Financials are based on the most recent Mortgage that was taken out on this home.
Original Mortgage
$242,165
Outstanding Balance
$219,250
Interest Rate
2.9%
Mortgage Type
New Conventional
Estimated Equity
$139,220
Purchase Details
Closed on
Dec 14, 2004
Sold by
James John
Bought by
Harver Lauren
Home Financials for this Owner
Home Financials are based on the most recent Mortgage that was taken out on this home.
Original Mortgage
$139,950
Interest Rate
5.68%
Mortgage Type
New Conventional
Purchase Details
Closed on
Oct 15, 1999
Sold by
Bellcreek Bldrs Inc
Bought by
James John W
Home Financials for this Owner
Home Financials are based on the most recent Mortgage that was taken out on this home.
Original Mortgage
$101,150
Interest Rate
7.83%
Create a Home Valuation Report for This Property
The Home Valuation Report is an in-depth analysis detailing your home's value as well as a comparison with similar homes in the area
Home Values in the Area
Average Home Value in this Area
Purchase History
| Date | Buyer | Sale Price | Title Company |
|---|---|---|---|
| Phillips Alfred M | $259,000 | Attorney | |
| Harver Lauren | $174,950 | -- | |
| James John W | $126,500 | -- |
Source: Public Records
Mortgage History
| Date | Status | Borrower | Loan Amount |
|---|---|---|---|
| Open | Phillips Alfred M | $242,165 | |
| Previous Owner | Harver Lauren | $139,950 | |
| Previous Owner | James John W | $101,150 |
Source: Public Records
Tax History Compared to Growth
Tax History
| Year | Tax Paid | Tax Assessment Tax Assessment Total Assessment is a certain percentage of the fair market value that is determined by local assessors to be the total taxable value of land and additions on the property. | Land | Improvement |
|---|---|---|---|---|
| 2025 | $2,475 | $305,600 | $90,000 | $215,600 |
| 2024 | $2,388 | $294,800 | $85,000 | $209,800 |
| 2023 | $2,051 | $266,400 | $80,000 | $186,400 |
| 2022 | $1,990 | $245,700 | $75,000 | $170,700 |
| 2021 | $1,918 | $236,800 | $70,000 | $166,800 |
| 2020 | $1,806 | $223,000 | $65,000 | $158,000 |
| 2019 | $1,543 | $215,000 | $60,000 | $155,000 |
| 2018 | $1,543 | $190,500 | $55,000 | $135,500 |
| 2017 | $1,543 | $190,500 | $55,000 | $135,500 |
| 2016 | $1,543 | $190,500 | $55,000 | $135,500 |
| 2015 | $1,432 | $176,800 | $55,000 | $121,800 |
| 2014 | $1,432 | $176,800 | $55,000 | $121,800 |
Source: Public Records
Map
Nearby Homes
- 7037 Lantana Ln
- 7016 Narragansett Ct
- 8208 Angela Nicole Ln
- 8132 Kiwi Ln
- 8195 J David Ln
- 6596 Magnolia Green Ln
- 8214 Janice Ave
- 6454 Midday Ln
- 8441 Colemanden Dr
- 8420 Lee Davis Rd
- 6267 Lake Point Dr
- 8009 Kenmore Dr
- 8323 Raven Run Dr
- 8005 Wynbrook Ln
- 8996 Brigadier Rd Unit 4A
- 9032 Fascine Ct
- 8347 Oxfordshire Place
- 0 Verdi Ln Unit 2513807
- 7520 Washington Arch Dr
- 9073 Pine Hill Rd
- 8205 Halycon Ln
- 8260 Willdosh Ct
- 8209 Halycon Ln
- 8204 Halycon Ln
- 8259 Willdosh Ct
- 8208 Halycon Ln
- 8213 Halycon Ln
- 7007 Merdith Farms Dr
- 6999 Merdith Farms Dr
- 8261 Willdosh Ct
- 8211 Christopher Paul Dr
- 8207 Christopher Paul Dr
- 6999 Meredith Farms Dr
- 8265 Willdosh Ct
- 6995 Merdith Farms Dr
- 6995 Meredith Farms Dr
- 7013 Merdith Farms Dr
- 7004 Meredith Farms Dr
- 8217 Prism Ct
- 8215 Christopher Paul Dr