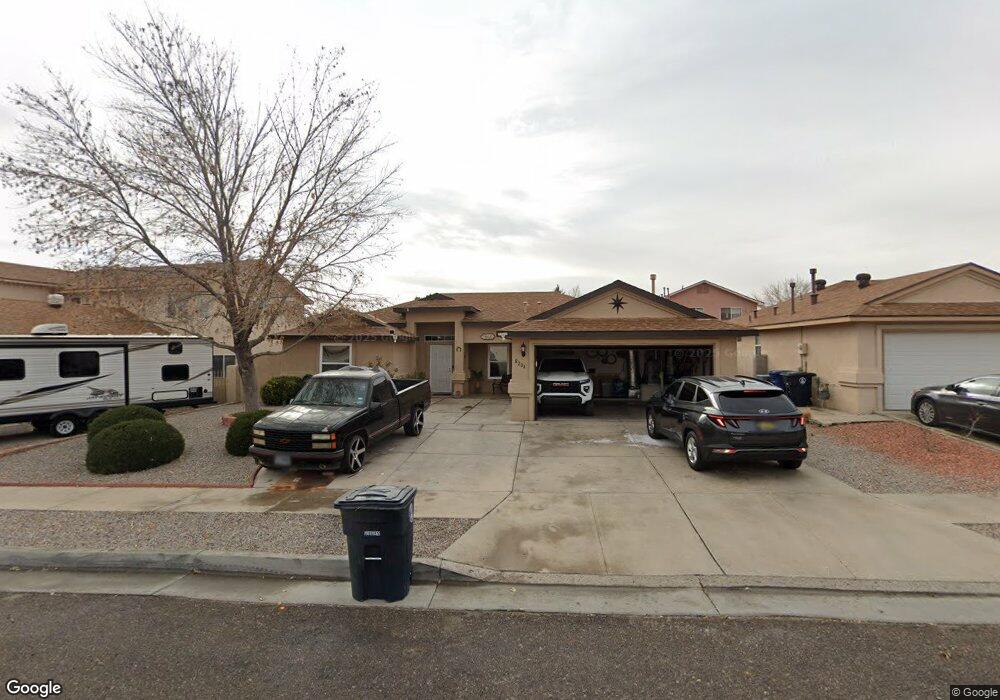
8204 Garnet Ave SW Albuquerque, NM 87121
Southwest Heights NeighborhoodEstimated Value: $261,000 - $293,000
3
Beds
2
Baths
1,420
Sq Ft
$196/Sq Ft
Est. Value
About This Home
This home is located at 8204 Garnet Ave SW, Albuquerque, NM 87121 and is currently estimated at $278,087, approximately $195 per square foot. 8204 Garnet Ave SW is a home located in Bernalillo County with nearby schools including Maryann Binford Elementary School, Truman Middle School, and Atrisco Heritage Academy High School.
Ownership History
Date
Name
Owned For
Owner Type
Purchase Details
Closed on
May 13, 2011
Sold by
Mirabal Chris P
Bought by
Ruiz Raul S and Ruiz Margarita
Current Estimated Value
Home Financials for this Owner
Home Financials are based on the most recent Mortgage that was taken out on this home.
Original Mortgage
$60,000
Outstanding Balance
$41,530
Interest Rate
4.87%
Mortgage Type
New Conventional
Estimated Equity
$236,557
Purchase Details
Closed on
Feb 25, 2005
Sold by
Laforte Jamy and Alderete Jamy
Bought by
Mirabal Chris P
Home Financials for this Owner
Home Financials are based on the most recent Mortgage that was taken out on this home.
Original Mortgage
$119,130
Interest Rate
5.77%
Mortgage Type
FHA
Purchase Details
Closed on
Sep 17, 1999
Sold by
Presley Homes
Bought by
Alderete Jamy
Home Financials for this Owner
Home Financials are based on the most recent Mortgage that was taken out on this home.
Original Mortgage
$106,683
Interest Rate
7.9%
Mortgage Type
FHA
Create a Home Valuation Report for This Property
The Home Valuation Report is an in-depth analysis detailing your home's value as well as a comparison with similar homes in the area
Home Values in the Area
Average Home Value in this Area
Purchase History
| Date | Buyer | Sale Price | Title Company |
|---|---|---|---|
| Ruiz Raul S | -- | Rio Grande Title Company Inc | |
| Mirabal Chris P | -- | First American Title Ins Co | |
| Alderete Jamy | -- | -- |
Source: Public Records
Mortgage History
| Date | Status | Borrower | Loan Amount |
|---|---|---|---|
| Open | Ruiz Raul S | $60,000 | |
| Previous Owner | Mirabal Chris P | $119,130 | |
| Previous Owner | Alderete Jamy | $106,683 |
Source: Public Records
Tax History Compared to Growth
Tax History
| Year | Tax Paid | Tax Assessment Tax Assessment Total Assessment is a certain percentage of the fair market value that is determined by local assessors to be the total taxable value of land and additions on the property. | Land | Improvement |
|---|---|---|---|---|
| 2025 | $1,776 | $45,417 | $12,048 | $33,369 |
| 2024 | $1,776 | $44,094 | $11,697 | $32,397 |
| 2023 | $1,829 | $42,811 | $11,357 | $31,454 |
| 2022 | $1,768 | $41,564 | $11,026 | $30,538 |
| 2021 | $1,709 | $40,354 | $10,705 | $29,649 |
| 2020 | $1,681 | $39,178 | $10,393 | $28,785 |
| 2019 | $1,631 | $38,038 | $10,091 | $27,947 |
| 2018 | $1,573 | $38,038 | $10,091 | $27,947 |
| 2017 | $1,525 | $36,930 | $9,797 | $27,133 |
| 2016 | $1,481 | $34,811 | $9,235 | $25,576 |
| 2015 | $33,797 | $33,797 | $8,966 | $24,831 |
| 2014 | $1,446 | $34,063 | $8,966 | $25,097 |
| 2013 | -- | $34,063 | $8,966 | $25,097 |
Source: Public Records
Map
Nearby Homes
- 7901 Purple Fringe Rd SW
- 1420 Summerfield Place SW
- 8600 Kimela Ct SW
- 7814 Desert Canyon Place SW
- 1815 Shadetree Dr SW
- 2503 Sancho Panza Way SW
- 1209 Locura Rd SW
- 7304 Autumn Sky Rd SW
- 1615 Quiet Desert Dr SW
- 8524 Stony Creek Rd SW
- 4301 Blake Trailer 40 Rd SW
- 8709 Rhonda Ave SW
- 9300 Jenny Ave SW
- 7605 Windsong Place SW
- 0 Sage Rd SW Unit 1085259
- 921 Roma Dora Ln
- 0 Nwq Unser and Sage SW Unit 1081546
- 9508 Sage Ranch Ct SW
- 1327 Amole Vista St SW
- 9504 Sage Ranch Ct
- 8208 Garnet Ave SW
- 8200 Garnet Ave SW
- 8205 Opal Mist Ct SW
- 8212 Garnet Ave SW Unit 3
- 8201 Opal Mist Ct SW
- 8112 Garnet Ave SW
- 8209 Garnet Ave SW
- 8111 Opal Mist Ct SW
- 8205 Garnet Ave SW
- 8211 Garnet Ave SW
- 8209 Opal Mist Ct SW
- 8108 Garnet Ave SW
- 8215 Garnet Ave SW
- 8201 Garnet Ave SW
- 1600 Corriz Dr SW
- 8109 Opal Mist Ct SW
- 1604 Corriz Dr SW
- 8111 Garnet Ave SW
- 1608 Corriz Dr SW
- 1524 Corriz Dr SW