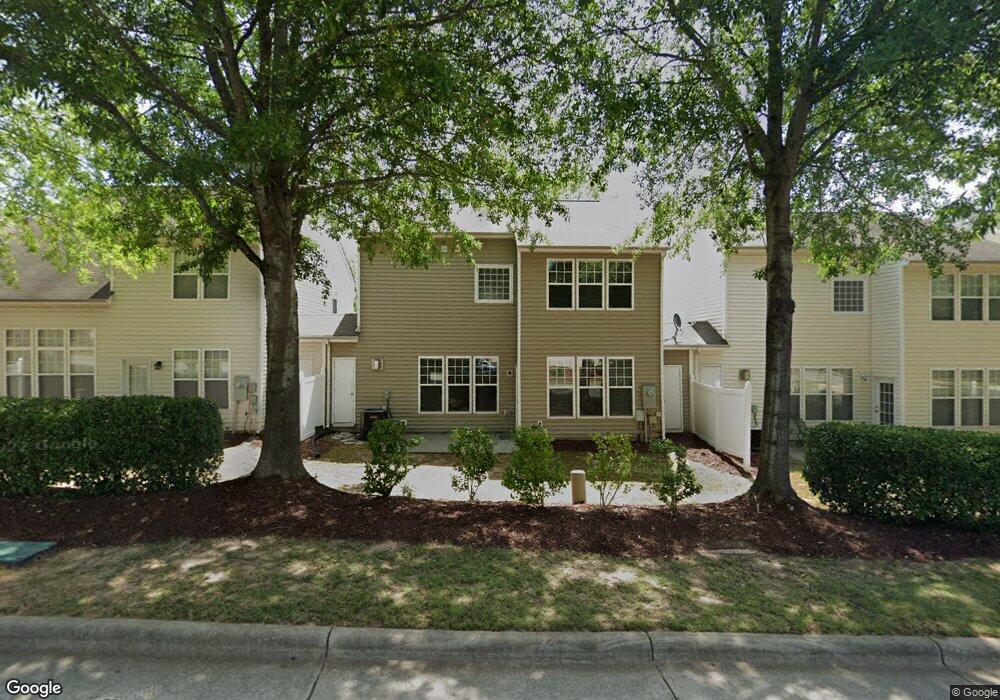
8205 Beaded Stone St Raleigh, NC 27613
Northwest Raleigh NeighborhoodEstimated Value: $427,000 - $458,000
3
Beds
3
Baths
2,000
Sq Ft
$220/Sq Ft
Est. Value
About This Home
This home is located at 8205 Beaded Stone St, Raleigh, NC 27613 and is currently estimated at $440,998, approximately $220 per square foot. 8205 Beaded Stone St is a home located in Wake County with nearby schools including Leesville Road Elementary School, Leesville Road Middle School, and Leesville Road High School.
Ownership History
Date
Name
Owned For
Owner Type
Purchase Details
Closed on
Mar 16, 2017
Sold by
Abbondanzio Katrina
Bought by
Farmand Anthony and Farmand Robert K
Current Estimated Value
Home Financials for this Owner
Home Financials are based on the most recent Mortgage that was taken out on this home.
Original Mortgage
$186,750
Outstanding Balance
$154,949
Interest Rate
4.19%
Mortgage Type
New Conventional
Estimated Equity
$286,049
Purchase Details
Closed on
Aug 29, 2013
Sold by
Fleming Sarah G
Bought by
Abbondanzio Katrina
Home Financials for this Owner
Home Financials are based on the most recent Mortgage that was taken out on this home.
Original Mortgage
$176,000
Interest Rate
3.75%
Mortgage Type
Adjustable Rate Mortgage/ARM
Purchase Details
Closed on
Jul 21, 2004
Sold by
Centex Homes
Bought by
Fleming Sarah G
Home Financials for this Owner
Home Financials are based on the most recent Mortgage that was taken out on this home.
Original Mortgage
$172,000
Interest Rate
4.5%
Mortgage Type
Unknown
Create a Home Valuation Report for This Property
The Home Valuation Report is an in-depth analysis detailing your home's value as well as a comparison with similar homes in the area
Home Values in the Area
Average Home Value in this Area
Purchase History
| Date | Buyer | Sale Price | Title Company |
|---|---|---|---|
| Farmand Anthony | $249,000 | None Available | |
| Abbondanzio Katrina | $220,000 | None Available | |
| Fleming Sarah G | $215,000 | -- |
Source: Public Records
Mortgage History
| Date | Status | Borrower | Loan Amount |
|---|---|---|---|
| Open | Farmand Anthony | $186,750 | |
| Previous Owner | Abbondanzio Katrina | $176,000 | |
| Previous Owner | Fleming Sarah G | $172,000 |
Source: Public Records
Tax History Compared to Growth
Tax History
| Year | Tax Paid | Tax Assessment Tax Assessment Total Assessment is a certain percentage of the fair market value that is determined by local assessors to be the total taxable value of land and additions on the property. | Land | Improvement |
|---|---|---|---|---|
| 2025 | $3,939 | $449,352 | $120,000 | $329,352 |
| 2024 | $3,923 | $449,352 | $120,000 | $329,352 |
| 2023 | $3,097 | $282,297 | $48,000 | $234,297 |
| 2022 | $2,878 | $282,297 | $48,000 | $234,297 |
| 2021 | $2,767 | $282,297 | $48,000 | $234,297 |
| 2020 | $2,717 | $282,297 | $48,000 | $234,297 |
| 2019 | $2,689 | $230,336 | $50,000 | $180,336 |
| 2018 | $2,537 | $230,336 | $50,000 | $180,336 |
| 2017 | $2,416 | $230,336 | $50,000 | $180,336 |
| 2016 | $2,367 | $230,336 | $50,000 | $180,336 |
| 2015 | $2,481 | $237,616 | $56,000 | $181,616 |
| 2014 | -- | $237,616 | $56,000 | $181,616 |
Source: Public Records
Map
Nearby Homes
- 8310 Chimneycap Dr
- 8512 Silsbee Dr
- 8245 Martello Ln
- 8253 Martello Ln
- 7805 Jeffrey Alan Ct
- 8424 Parkstone Dr
- 8325 Pilots View Dr
- 8412 Pilots View Dr
- 8511 Bright Loop
- 7705 Jackson Dane Dr
- 8212 Clasara Cir
- 8106 Sommerwell St
- 8719 Cypress Grove Run
- 8032 Sycamore Hill Ln
- 8729 Cypress Grove Run
- 8228 Clarks Branch Dr
- 8016 Sycamore Hill Ln
- 8020 Goldenrain Way
- 8939 Camden Park Dr
- 8025 Goldenrain Way
- 8203 Beaded Stone St
- 8207 Beaded Stone St
- 8209 Beaded Stone St
- 8201 Beaded Stone St
- 8406 Drystone Dr
- 8407 Drystone Dr
- 8204 Shadow Stone Ct
- 8404 Drystone Dr
- 8210 Beaded Stone St
- 8405 Drystone Dr
- 8202 Shadow Stone Ct
- 8213 Beaded Stone St
- 8206 Shadow Stone Ct
- 8212 Beaded Stone St
- 8403 Drystone Dr
- 8402 Drystone Dr
- 8215 Beaded Stone St
- 8208 Shadow Stone Ct
- 8214 Beaded Stone St
- 8401 Drystone Dr