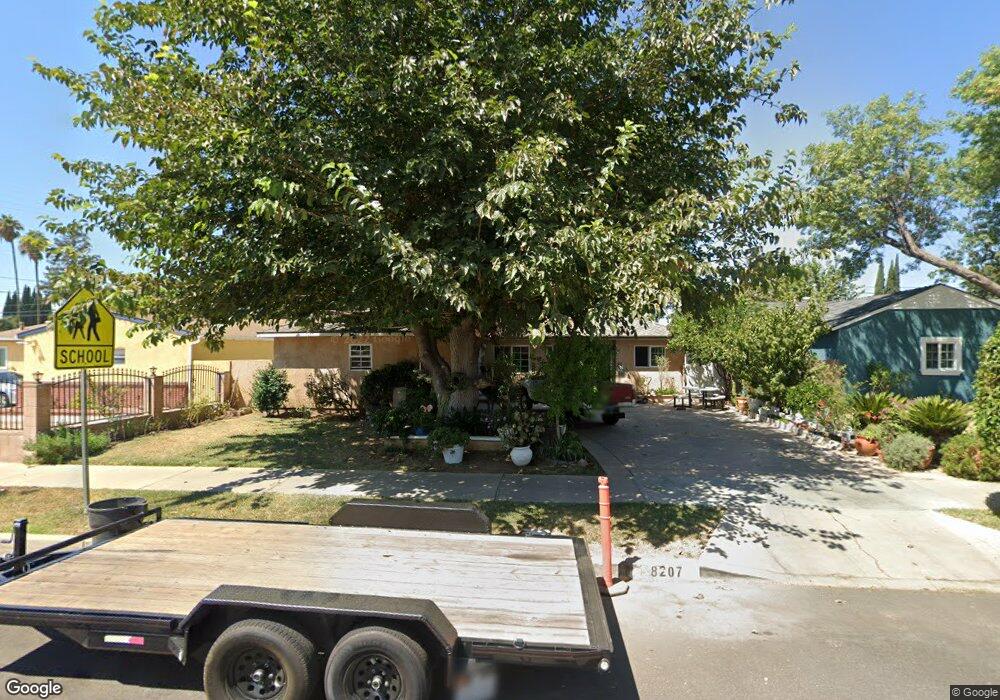
8207 Hesperia Ave Reseda, CA 91335
Estimated Value: $769,000 - $804,000
4
Beds
2
Baths
1,212
Sq Ft
$649/Sq Ft
Est. Value
About This Home
This home is located at 8207 Hesperia Ave, Reseda, CA 91335 and is currently estimated at $786,971, approximately $649 per square foot. 8207 Hesperia Ave is a home located in Los Angeles County with nearby schools including Cantara Street Elementary School, Northridge Middle School, and Northridge Academy High.
Ownership History
Date
Name
Owned For
Owner Type
Purchase Details
Closed on
Oct 24, 2001
Sold by
Carrascoza Roxana
Bought by
Carrascoza Evelio R
Current Estimated Value
Home Financials for this Owner
Home Financials are based on the most recent Mortgage that was taken out on this home.
Original Mortgage
$212,800
Outstanding Balance
$82,993
Interest Rate
6.84%
Estimated Equity
$703,978
Purchase Details
Closed on
Sep 27, 2001
Sold by
Lara Angel Gabriel and Lara Erick Daniel
Bought by
Carrascoza Evelio R
Home Financials for this Owner
Home Financials are based on the most recent Mortgage that was taken out on this home.
Original Mortgage
$212,800
Outstanding Balance
$82,993
Interest Rate
6.84%
Estimated Equity
$703,978
Purchase Details
Closed on
Apr 25, 2001
Sold by
Limlamai Kuard and Limlamai Manida
Bought by
Lara Angel Gabriel
Home Financials for this Owner
Home Financials are based on the most recent Mortgage that was taken out on this home.
Original Mortgage
$165,404
Interest Rate
7.14%
Mortgage Type
FHA
Create a Home Valuation Report for This Property
The Home Valuation Report is an in-depth analysis detailing your home's value as well as a comparison with similar homes in the area
Home Values in the Area
Average Home Value in this Area
Purchase History
| Date | Buyer | Sale Price | Title Company |
|---|---|---|---|
| Carrascoza Evelio R | -- | Southland Title | |
| Carrascoza Evelio R | $224,000 | Southland Title | |
| Lara Angel Gabriel | $168,000 | Southland Title |
Source: Public Records
Mortgage History
| Date | Status | Borrower | Loan Amount |
|---|---|---|---|
| Open | Carrascoza Evelio R | $212,800 | |
| Previous Owner | Lara Angel Gabriel | $165,404 |
Source: Public Records
Tax History
| Year | Tax Paid | Tax Assessment Tax Assessment Total Assessment is a certain percentage of the fair market value that is determined by local assessors to be the total taxable value of land and additions on the property. | Land | Improvement |
|---|---|---|---|---|
| 2025 | $4,085 | $330,302 | $237,096 | $93,206 |
| 2024 | $4,085 | $323,827 | $232,448 | $91,379 |
| 2023 | $4,008 | $317,479 | $227,891 | $89,588 |
| 2022 | $3,822 | $311,255 | $223,423 | $87,832 |
| 2021 | $3,772 | $305,153 | $219,043 | $86,110 |
| 2019 | $3,660 | $296,104 | $212,547 | $83,557 |
| 2018 | $3,626 | $290,299 | $208,380 | $81,919 |
| 2016 | $3,457 | $279,029 | $200,290 | $78,739 |
| 2015 | $3,408 | $274,839 | $197,282 | $77,557 |
| 2014 | $3,427 | $269,456 | $193,418 | $76,038 |
Source: Public Records
Map
Nearby Homes
- 8400 Chimineas Ave
- 8421 Lindley Ave
- 8006 Zelzah Ave
- 8051 Etiwanda Ave
- 8503 Newcastle Ave
- 17734 Baltar St
- 17740 Baltar St
- 7848 Chastain Ave
- 8031 Canby Ave Unit 4
- 18443 W Montage Ln
- 7758 Chimineas Ave
- 17800 Raymer St
- 8350 Reseda Blvd
- 17845 Stagg St
- 8134 Baird Ave
- 7732 Garden Grove Ave
- 18350 Napa St
- 18404 Arminta St
- 18320 Ingomar St
- 8161 Encino Ave
- 8213 Hesperia Ave
- 8201 Hesperia Ave
- 8206 Lindley Ave
- 8219 Hesperia Ave
- 8212 Lindley Ave
- 8200 Lindley Ave
- 18027 Cantara St
- 18028 Burton St
- 8218 Lindley Ave
- 8208 Lindley Ave Unit ADU
- 8208 Lindley Ave
- 8155 Hesperia Ave
- 18021 Cantara St
- 18035 Burton St
- 18022 Burton St
- 8224 Lindley Ave
- 8160 Lindley Ave
- 18031 Burton St
- 8149 Hesperia Ave
- 18015 Cantara St
Your Personal Tour Guide
Ask me questions while you tour the home.