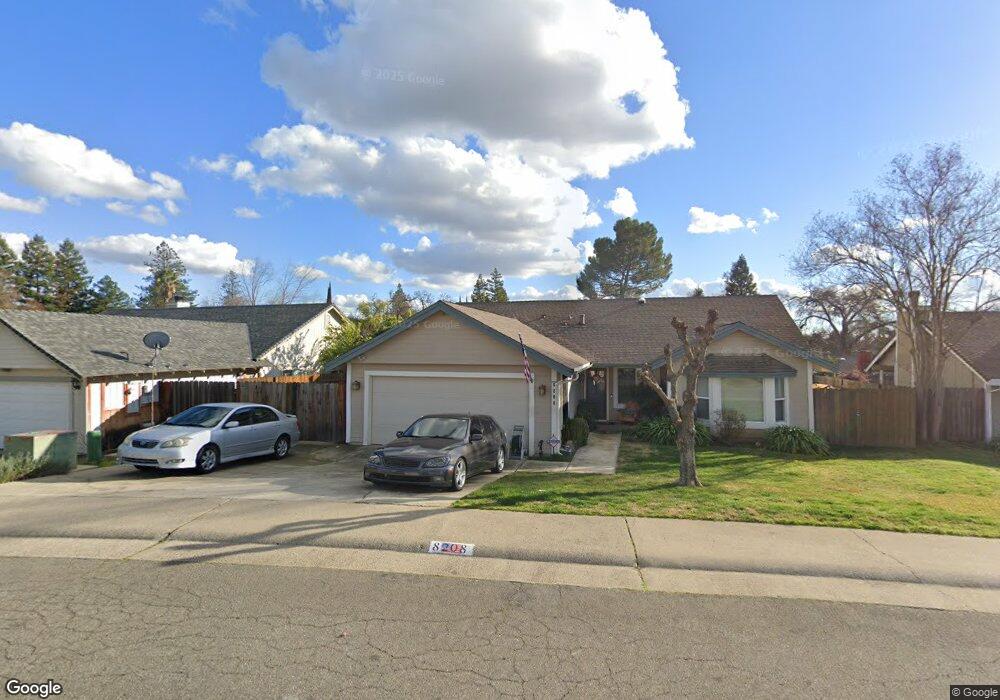
8208 Oakenshaw Way Orangevale, CA 95662
Estimated Value: $493,055 - $550,000
4
Beds
2
Baths
1,484
Sq Ft
$356/Sq Ft
Est. Value
About This Home
This home is located at 8208 Oakenshaw Way, Orangevale, CA 95662 and is currently estimated at $528,264, approximately $355 per square foot. 8208 Oakenshaw Way is a home located in Sacramento County with nearby schools including Oakview Community Elementary School, Louis Pasteur Fundamental Middle School, and Casa Roble Fundamental High School.
Ownership History
Date
Name
Owned For
Owner Type
Purchase Details
Closed on
May 11, 1999
Sold by
Mouras Belton
Bought by
Bernard James O and Bernard Sharon D
Current Estimated Value
Home Financials for this Owner
Home Financials are based on the most recent Mortgage that was taken out on this home.
Original Mortgage
$144,814
Outstanding Balance
$37,107
Interest Rate
6.94%
Mortgage Type
FHA
Estimated Equity
$491,157
Purchase Details
Closed on
Sep 25, 1998
Sold by
Hughes David and Hughes Cora P
Bought by
Mouras Belton
Home Financials for this Owner
Home Financials are based on the most recent Mortgage that was taken out on this home.
Original Mortgage
$97,500
Interest Rate
6.88%
Purchase Details
Closed on
Mar 12, 1996
Sold by
Hughes David and Hughes Cora P
Bought by
Hughes Cora P and Hughes David A
Create a Home Valuation Report for This Property
The Home Valuation Report is an in-depth analysis detailing your home's value as well as a comparison with similar homes in the area
Home Values in the Area
Average Home Value in this Area
Purchase History
| Date | Buyer | Sale Price | Title Company |
|---|---|---|---|
| Bernard James O | $146,500 | Fidelity National Title Co | |
| Mouras Belton | $97,500 | Fidelity National Title Co | |
| Hughes Cora P | -- | -- |
Source: Public Records
Mortgage History
| Date | Status | Borrower | Loan Amount |
|---|---|---|---|
| Open | Bernard James O | $144,814 | |
| Previous Owner | Mouras Belton | $97,500 |
Source: Public Records
Tax History Compared to Growth
Tax History
| Year | Tax Paid | Tax Assessment Tax Assessment Total Assessment is a certain percentage of the fair market value that is determined by local assessors to be the total taxable value of land and additions on the property. | Land | Improvement |
|---|---|---|---|---|
| 2025 | $2,687 | $229,645 | $62,695 | $166,950 |
| 2024 | $2,687 | $225,143 | $61,466 | $163,677 |
| 2023 | $2,619 | $220,729 | $60,261 | $160,468 |
| 2022 | $2,604 | $216,402 | $59,080 | $157,322 |
| 2021 | $2,560 | $212,160 | $57,922 | $154,238 |
| 2020 | $2,513 | $209,986 | $57,329 | $152,657 |
| 2019 | $2,462 | $205,869 | $56,205 | $149,664 |
| 2018 | $2,433 | $201,833 | $55,103 | $146,730 |
| 2017 | $2,408 | $197,876 | $54,023 | $143,853 |
| 2016 | $2,252 | $193,997 | $52,964 | $141,033 |
| 2015 | $2,213 | $191,084 | $52,169 | $138,915 |
| 2014 | $2,167 | $187,342 | $51,148 | $136,194 |
Source: Public Records
Map
Nearby Homes
- 8122 Stacey Hills Dr
- 7260 Mandarin Cir
- 6813 Mellodora Dr
- 8052 Cammeray Dr
- 8078 Oak Meadow Ct
- 8047 Mcclung Dr
- 8311 Juglans Dr
- 8075 Alma Mesa Way
- 8205 Lash Larue Ln
- 7517 Quail Vista Ln
- 8429 Menke Way
- 7080 Canelo Hills Dr
- 8021 Dana Butte Way
- 8033 Larwin Dr
- 6929 Lyonia Way
- 7156 Woodmore Oaks Dr
- 7616 Wooddale Way
- 7412 Fox Hills Dr
- 8609 Briarbrook Cir
- 7970 Larwin Dr
- 8212 Oakenshaw Way
- 8204 Oakenshaw Way
- 7027 Short Oak Way
- 8200 Oakenshaw Way
- 8203 Oakenshaw Way
- 8209 Oakenshaw Way
- 7021 Short Oak Way
- 8213 Oakenshaw Way
- 8201 Oakenshaw Way
- 7028 Short Oak Way
- 7036 Cross Dr
- 8217 Oakenshaw Way
- 8220 Oakenshaw Way
- 7022 Short Oak Way
- 7017 Short Oak Way
- 7130 Cross Dr
- 8204 Prime Way
- 8208 Prime Way
- 8221 Oakenshaw Way
- 7026 Cross Dr