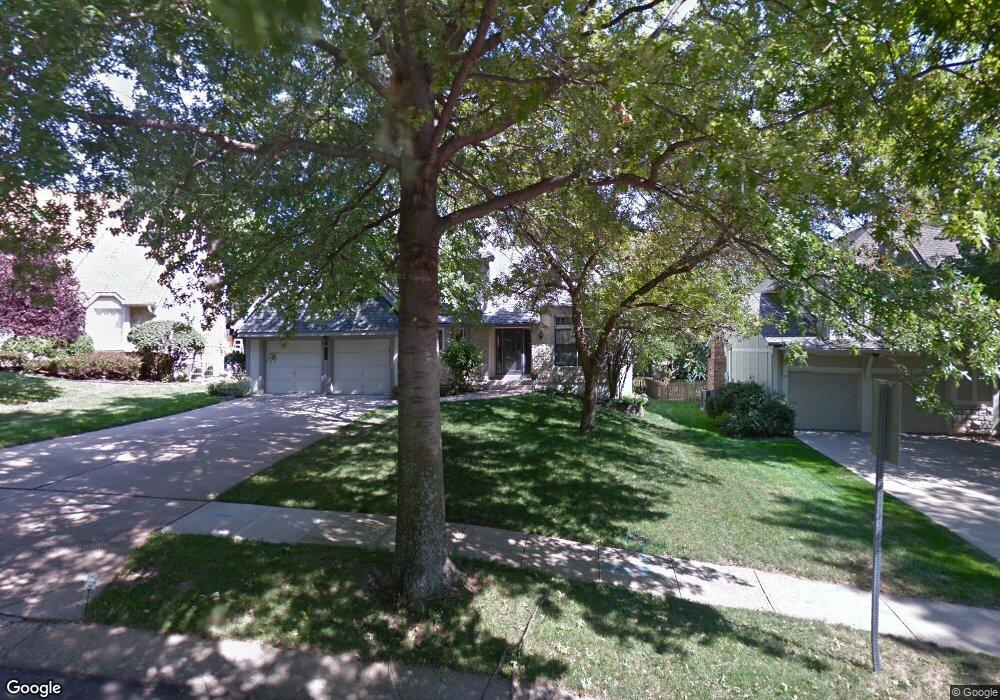
8209 Acuff Ln Lenexa, KS 66215
Estimated Value: $488,000 - $507,835
4
Beds
5
Baths
2,658
Sq Ft
$188/Sq Ft
Est. Value
About This Home
This home is located at 8209 Acuff Ln, Lenexa, KS 66215 and is currently estimated at $498,959, approximately $187 per square foot. 8209 Acuff Ln is a home located in Johnson County with nearby schools including Rising Star Elementary School, Westridge Middle School, and Shawnee Mission West High School.
Ownership History
Date
Name
Owned For
Owner Type
Purchase Details
Closed on
Aug 26, 2011
Sold by
Watkins Gerald F and Watkins Nancy
Bought by
Neuburger Mary L and Neuburger Patrick M
Current Estimated Value
Home Financials for this Owner
Home Financials are based on the most recent Mortgage that was taken out on this home.
Original Mortgage
$162,500
Outstanding Balance
$110,685
Interest Rate
4.53%
Mortgage Type
New Conventional
Estimated Equity
$388,274
Purchase Details
Closed on
Apr 27, 2005
Sold by
Watkins Jeanie R
Bought by
Watkins Gerald F
Home Financials for this Owner
Home Financials are based on the most recent Mortgage that was taken out on this home.
Original Mortgage
$105,300
Interest Rate
5.6%
Mortgage Type
New Conventional
Create a Home Valuation Report for This Property
The Home Valuation Report is an in-depth analysis detailing your home's value as well as a comparison with similar homes in the area
Home Values in the Area
Average Home Value in this Area
Purchase History
| Date | Buyer | Sale Price | Title Company |
|---|---|---|---|
| Neuburger Mary L | -- | Chicago Title Company Llc | |
| Watkins Gerald F | -- | None Available |
Source: Public Records
Mortgage History
| Date | Status | Borrower | Loan Amount |
|---|---|---|---|
| Open | Neuburger Mary L | $162,500 | |
| Previous Owner | Watkins Gerald F | $105,300 |
Source: Public Records
Tax History
| Year | Tax Paid | Tax Assessment Tax Assessment Total Assessment is a certain percentage of the fair market value that is determined by local assessors to be the total taxable value of land and additions on the property. | Land | Improvement |
|---|---|---|---|---|
| 2025 | $5,610 | $53,889 | $10,356 | $43,533 |
| 2024 | $5,610 | $50,635 | $9,007 | $41,628 |
| 2023 | $5,761 | $51,198 | $9,007 | $42,191 |
| 2022 | $5,156 | $45,793 | $7,834 | $37,959 |
| 2021 | $4,681 | $39,491 | $7,449 | $32,042 |
| 2020 | $4,601 | $38,433 | $7,449 | $30,984 |
| 2019 | $4,549 | $37,985 | $7,449 | $30,536 |
| 2018 | $4,199 | $37,916 | $7,449 | $30,467 |
| 2017 | $4,160 | $33,350 | $5,888 | $27,462 |
| 2016 | $4,169 | $33,017 | $5,888 | $27,129 |
| 2015 | $3,819 | $30,429 | $5,888 | $24,541 |
| 2013 | -- | $28,647 | $5,888 | $22,759 |
Source: Public Records
Map
Nearby Homes
- 8041 Acuff Ln
- 8004 Constance St
- 8362 Oakview Cir
- 14828 W 83rd Place
- 14925 W 82nd Terrace
- 8443 Alden St
- 7908 Park St
- 8403 Swarner Dr
- 7736 Darnell St
- 8645 Greenwood Ln
- 13403 W 78th Place
- 15318 W 80th Place
- 13212 W 84th St
- 13408 W 78th Terrace
- 8221 Noland Rd
- 7618 Constance St
- 8033 Hall St
- 7920 Gillette St
- 13204 W 85th Ct
- 8740 Park St
- 8203 Acuff Ln
- 8215 Acuff Ln
- 14222 W 83rd St
- 14221 W 82nd St
- 8151 Acuff Ln
- 14215 W 82nd St
- 8200 Acuff Ln
- 8212 Acuff Ln
- 14216 W 83rd St
- 8143 Acuff Ln
- 14207 W 82nd St
- 14225 W 82nd St
- 8138 Acuff Ln
- 14208 W 83rd St
- 14351 W 81st Place
- 14404 W 83rd St
- 14201 W 82nd St
- 14224 W 82nd St
- 8132 Acuff Ln
- 14202 W 83rd St
Your Personal Tour Guide
Ask me questions while you tour the home.