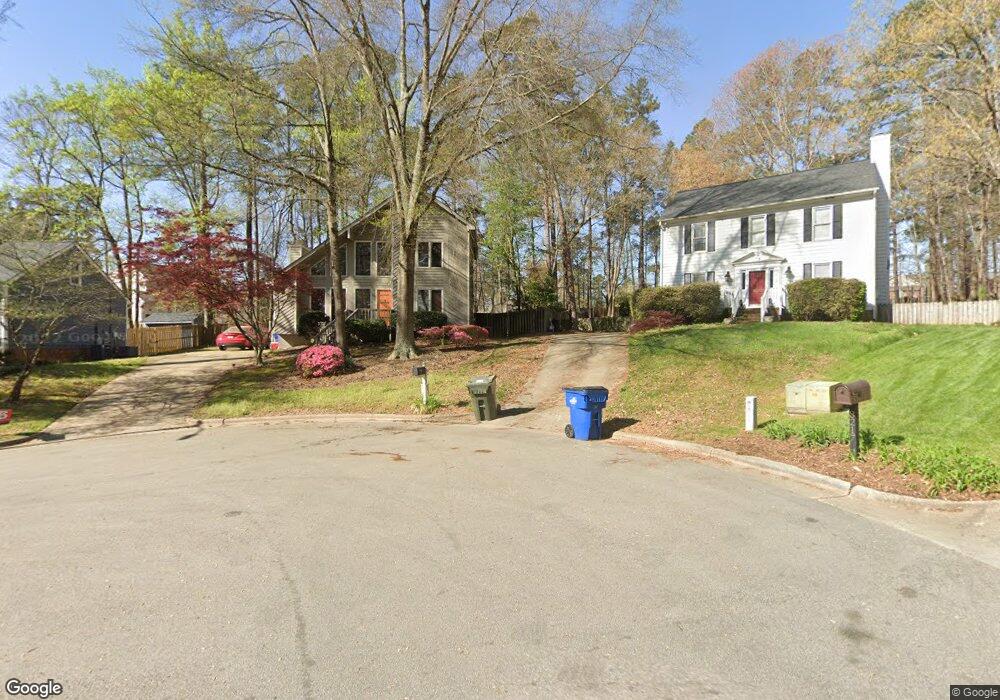
8209 Hambledon Ct Raleigh, NC 27615
Estimated Value: $423,676 - $498,000
3
Beds
2
Baths
1,720
Sq Ft
$268/Sq Ft
Est. Value
About This Home
This home is located at 8209 Hambledon Ct, Raleigh, NC 27615 and is currently estimated at $460,919, approximately $267 per square foot. 8209 Hambledon Ct is a home located in Wake County with nearby schools including Pleasant Union Elementary School, West Millbrook Middle School, and Sanderson High School.
Ownership History
Date
Name
Owned For
Owner Type
Purchase Details
Closed on
Jul 27, 2020
Sold by
Rodriguez Michelle Ann
Bought by
Rodriguez Maria
Current Estimated Value
Home Financials for this Owner
Home Financials are based on the most recent Mortgage that was taken out on this home.
Original Mortgage
$324,022
Outstanding Balance
$287,854
Interest Rate
3.2%
Mortgage Type
FHA
Estimated Equity
$173,065
Purchase Details
Closed on
Nov 1, 2018
Sold by
Carlson Nancy Lee
Bought by
Rodriguez Michelle Ann
Home Financials for this Owner
Home Financials are based on the most recent Mortgage that was taken out on this home.
Original Mortgage
$197,200
Interest Rate
4.6%
Mortgage Type
New Conventional
Purchase Details
Closed on
Dec 20, 2013
Sold by
Congleton Nancy C and Carlson Nancy Lee
Bought by
Carlson Nancy Lee
Purchase Details
Closed on
Feb 11, 1999
Sold by
Congleton Keith L
Bought by
Congleton Nancy C
Purchase Details
Closed on
Apr 4, 1986
Bought by
Carlson Nancy Lee
Create a Home Valuation Report for This Property
The Home Valuation Report is an in-depth analysis detailing your home's value as well as a comparison with similar homes in the area
Home Values in the Area
Average Home Value in this Area
Purchase History
| Date | Buyer | Sale Price | Title Company |
|---|---|---|---|
| Rodriguez Maria | $330,000 | None Available | |
| Rodriguez Michelle Ann | $246,500 | None Available | |
| Carlson Nancy Lee | -- | None Available | |
| Congleton Nancy C | -- | -- | |
| Carlson Nancy Lee | $117,000 | -- |
Source: Public Records
Mortgage History
| Date | Status | Borrower | Loan Amount |
|---|---|---|---|
| Open | Rodriguez Maria | $324,022 | |
| Previous Owner | Rodriguez Michelle Ann | $197,200 |
Source: Public Records
Tax History Compared to Growth
Tax History
| Year | Tax Paid | Tax Assessment Tax Assessment Total Assessment is a certain percentage of the fair market value that is determined by local assessors to be the total taxable value of land and additions on the property. | Land | Improvement |
|---|---|---|---|---|
| 2025 | $3,263 | $371,840 | $85,000 | $286,840 |
| 2024 | $3,249 | $371,840 | $85,000 | $286,840 |
| 2023 | $2,901 | $264,352 | $85,000 | $179,352 |
| 2022 | $2,697 | $264,352 | $85,000 | $179,352 |
| 2021 | $2,592 | $264,352 | $85,000 | $179,352 |
| 2020 | $2,545 | $264,352 | $85,000 | $179,352 |
| 2019 | $2,419 | $206,996 | $68,000 | $138,996 |
| 2018 | $2,282 | $206,996 | $68,000 | $138,996 |
| 2017 | $2,173 | $206,996 | $68,000 | $138,996 |
| 2016 | $2,129 | $206,996 | $68,000 | $138,996 |
| 2015 | $1,993 | $190,581 | $68,000 | $122,581 |
| 2014 | $1,891 | $190,581 | $68,000 | $122,581 |
Source: Public Records
Map
Nearby Homes
- 7929 Featherstone Dr
- 8305 Society Place
- 302 Bon Marche Ln
- 8231 Allyns Landing Way Unit 101
- 206 Nouveau Ave
- 7901 Featherstone Dr
- 8011 Allyns Landing Way Unit 202
- 8325 Stryker Ct
- 42 Renwick Ct
- 8415 Zinc Autumn Path
- 8124 Upper Lake Dr
- 8004 Thrush Ridge Ln
- 8109 Olde Hill Ct
- 8021 Thrush Ridge Ln
- 7731 Kingsberry Ct
- 7715 Kingsberry Ct
- 313 Crown Oaks Dr
- 8015 Brown Bark Place
- 8304 Wycombe Ln
- 8009 Running Cedar Trail
- 8213 Hambledon Ct
- 8205 Hambledon Ct
- 7944 Featherstone Dr
- 8217 Hambledon Ct
- 8201 Hambledon Ct
- 8216 Hambledon Ct
- 8208 Hambledon Ct
- 8212 Hambledon Ct
- 8204 Hambledon Ct
- 8200 Hambledon Ct
- 7933 Featherstone Dr
- 8352 Six Forks Rd
- 8354 Six Forks Rd Unit 103
- 7931 Monument Ln
- 8305 Six Forks Rd
- 8305 Six Forks Rd Unit 207
- 8104 Kennett Village Ct
- 8307 Six Forks Rd
- 8307 Six Forks Rd Unit 203
- 8307 Six Forks Rd Unit 201