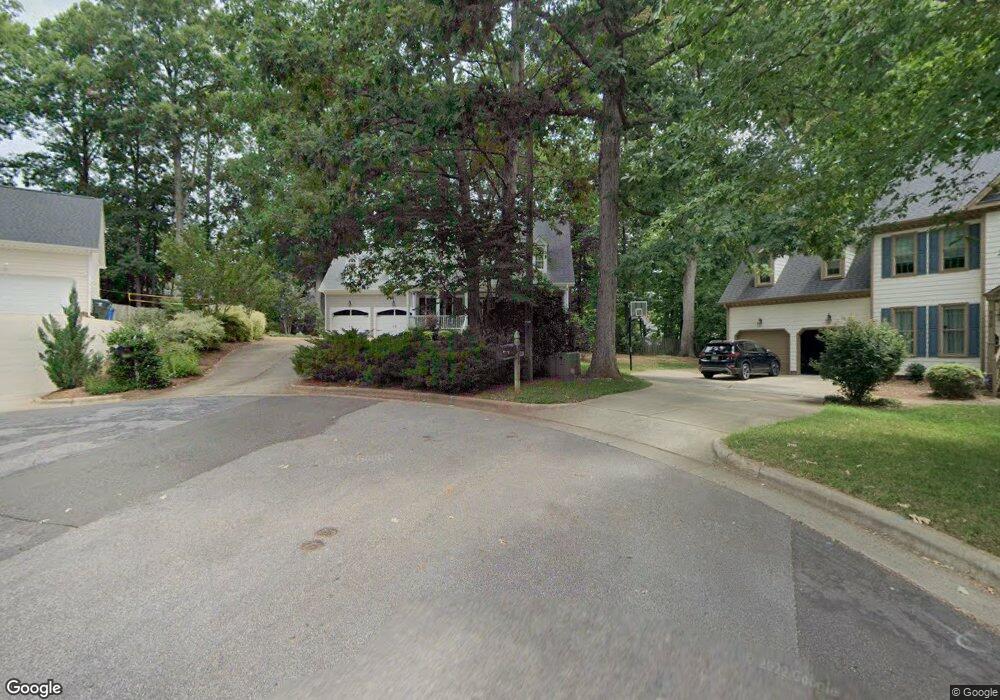
8209 Nolichucky Ct Raleigh, NC 27612
Estimated Value: $665,000 - $743,000
3
Beds
3
Baths
2,333
Sq Ft
$300/Sq Ft
Est. Value
About This Home
This home is located at 8209 Nolichucky Ct, Raleigh, NC 27612 and is currently estimated at $700,516, approximately $300 per square foot. 8209 Nolichucky Ct is a home located in Wake County with nearby schools including Leesville Road Elementary School, Leesville Road Middle School, and Leesville Road High School.
Ownership History
Date
Name
Owned For
Owner Type
Purchase Details
Closed on
Feb 29, 2012
Sold by
Sproul Matthew T and Sproul Kelly S
Bought by
Millward Stephen Keith and Chase Christine M
Current Estimated Value
Home Financials for this Owner
Home Financials are based on the most recent Mortgage that was taken out on this home.
Original Mortgage
$120,000
Outstanding Balance
$14,713
Interest Rate
3.16%
Mortgage Type
New Conventional
Estimated Equity
$685,803
Purchase Details
Closed on
Dec 22, 2008
Sold by
Wagner Maria
Bought by
Sproul Matthew T and Sproul Kelly C
Home Financials for this Owner
Home Financials are based on the most recent Mortgage that was taken out on this home.
Original Mortgage
$323,000
Interest Rate
5.08%
Mortgage Type
Purchase Money Mortgage
Purchase Details
Closed on
Jul 13, 2001
Sold by
Armington Robert M and Hocking Leslie Beth
Bought by
Wagner Maria
Home Financials for this Owner
Home Financials are based on the most recent Mortgage that was taken out on this home.
Original Mortgage
$171,500
Interest Rate
7.23%
Create a Home Valuation Report for This Property
The Home Valuation Report is an in-depth analysis detailing your home's value as well as a comparison with similar homes in the area
Home Values in the Area
Average Home Value in this Area
Purchase History
| Date | Buyer | Sale Price | Title Company |
|---|---|---|---|
| Millward Stephen Keith | $340,000 | None Available | |
| Sproul Matthew T | $323,000 | None Available | |
| Wagner Maria | $245,000 | -- |
Source: Public Records
Mortgage History
| Date | Status | Borrower | Loan Amount |
|---|---|---|---|
| Open | Millward Stephen Keith | $120,000 | |
| Previous Owner | Sproul Matthew T | $323,000 | |
| Previous Owner | Wagner Maria | $171,500 |
Source: Public Records
Tax History Compared to Growth
Tax History
| Year | Tax Paid | Tax Assessment Tax Assessment Total Assessment is a certain percentage of the fair market value that is determined by local assessors to be the total taxable value of land and additions on the property. | Land | Improvement |
|---|---|---|---|---|
| 2025 | $5,598 | $639,600 | $240,000 | $399,600 |
| 2024 | $5,575 | $639,600 | $240,000 | $399,600 |
| 2023 | $4,532 | $413,981 | $105,000 | $308,981 |
| 2022 | $4,212 | $413,981 | $105,000 | $308,981 |
| 2021 | $4,048 | $413,981 | $105,000 | $308,981 |
| 2020 | $3,974 | $413,981 | $105,000 | $308,981 |
| 2019 | $4,242 | $364,286 | $105,000 | $259,286 |
| 2018 | $4,000 | $364,286 | $105,000 | $259,286 |
| 2017 | $3,810 | $364,286 | $105,000 | $259,286 |
| 2016 | $0 | $364,286 | $105,000 | $259,286 |
| 2015 | -- | $353,330 | $120,000 | $233,330 |
| 2014 | -- | $353,330 | $120,000 | $233,330 |
Source: Public Records
Map
Nearby Homes
- 8004 Looking Glass Ct
- 8118 Primanti Blvd
- 8016 Sycamore Hill Ln
- 8032 Sycamore Hill Ln
- 7504 Panther Branch Dr
- 8719 Cypress Grove Run
- 8025 Goldenrain Way
- 8741 Cypress Grove
- 8106 Sommerwell St
- 8511 Bright Loop
- 8823 Orchard Grove Way
- 8143 Rhiannon Rd
- 5606 Berry Creek Cir
- 5634 Berry Creek Cir
- 7705 Jackson Dane Dr
- 8512 Silsbee Dr
- 7226 Corvette Ct
- 7253 Galon Glen Rd
- 8219 Martello Ln
- 7440 Lagrange Dr
- 8208 Nolichucky Ct
- 7619 Astoria Place Unit 11A
- 8205 Nolichucky Ct
- 7617 Astoria Place
- 7623 Astoria Place
- 7615 Astoria Place Unit 11C
- 7625 Astoria Place
- 8113 Pony Pasture Ct
- 7613 Astoria Place Unit 11D
- 7627 Astoria Place
- 8117 Pony Pasture Ct
- 8101 Gabriels Bend Dr
- 7629 Astoria Place Unit 12B
- 8109 Pony Pasture Ct
- 8041 Gabriels Bend Dr
- 7611 Astoria Place Unit 11E
- 7631 Astoria Place
- 8121 Pony Pasture Ct
- 8105 Pony Pasture Ct
- 7635 Astoria Place