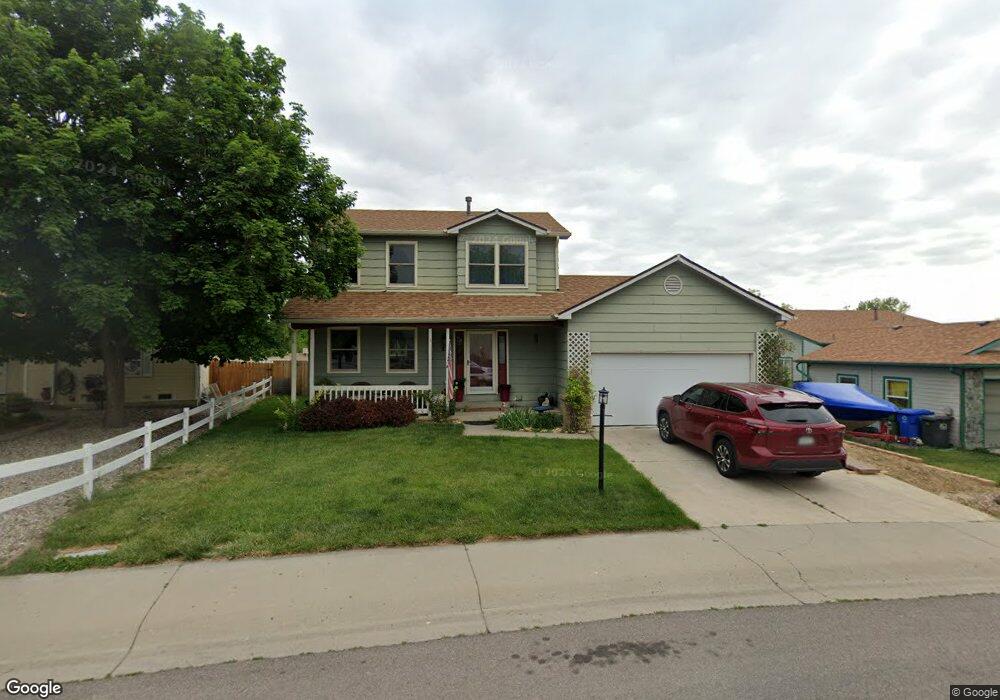
821 23rd St SW Loveland, CO 80537
Estimated Value: $469,000 - $506,000
3
Beds
3
Baths
2,192
Sq Ft
$221/Sq Ft
Est. Value
About This Home
This home is located at 821 23rd St SW, Loveland, CO 80537 and is currently estimated at $485,502, approximately $221 per square foot. 821 23rd St SW is a home located in Larimer County with nearby schools including B. F. Kitchen Elementary School, Bill Reed Middle School, and Thompson Valley High School.
Ownership History
Date
Name
Owned For
Owner Type
Purchase Details
Closed on
Dec 31, 2001
Sold by
Ndlovu Hickey Sithembile
Bought by
Foley Robert D and Foley Tammy J
Current Estimated Value
Home Financials for this Owner
Home Financials are based on the most recent Mortgage that was taken out on this home.
Original Mortgage
$168,150
Outstanding Balance
$64,202
Interest Rate
6.12%
Estimated Equity
$421,300
Purchase Details
Closed on
May 30, 1997
Sold by
Middleton Douglas E Debra A
Bought by
Ndlovu Hickey Sithembile
Home Financials for this Owner
Home Financials are based on the most recent Mortgage that was taken out on this home.
Original Mortgage
$130,295
Interest Rate
8.17%
Mortgage Type
Purchase Money Mortgage
Purchase Details
Closed on
Dec 1, 1993
Sold by
Keirns Construction Co
Bought by
Middleton Debra A
Purchase Details
Closed on
Aug 1, 1993
Sold by
Stormo Alan C
Bought by
Keirns Construction Co
Purchase Details
Closed on
Apr 1, 1993
Sold by
Commodore Construction Inc
Bought by
Stormo Alan C
Create a Home Valuation Report for This Property
The Home Valuation Report is an in-depth analysis detailing your home's value as well as a comparison with similar homes in the area
Home Values in the Area
Average Home Value in this Area
Purchase History
| Date | Buyer | Sale Price | Title Company |
|---|---|---|---|
| Foley Robert D | $177,000 | -- | |
| Ndlovu Hickey Sithembile | $126,500 | -- | |
| Middleton Debra A | $110,000 | -- | |
| Keirns Construction Co | $17,500 | -- | |
| Stormo Alan C | -- | -- |
Source: Public Records
Mortgage History
| Date | Status | Borrower | Loan Amount |
|---|---|---|---|
| Open | Foley Robert D | $168,150 | |
| Previous Owner | Ndlovu Hickey Sithembile | $130,295 |
Source: Public Records
Tax History Compared to Growth
Tax History
| Year | Tax Paid | Tax Assessment Tax Assessment Total Assessment is a certain percentage of the fair market value that is determined by local assessors to be the total taxable value of land and additions on the property. | Land | Improvement |
|---|---|---|---|---|
| 2025 | $2,346 | $33,078 | $2,077 | $31,001 |
| 2024 | $2,262 | $33,078 | $2,077 | $31,001 |
| 2022 | $2,074 | $26,070 | $2,155 | $23,915 |
| 2021 | $2,132 | $26,820 | $2,217 | $24,603 |
| 2020 | $1,854 | $23,317 | $2,217 | $21,100 |
| 2019 | $1,823 | $23,317 | $2,217 | $21,100 |
| 2018 | $1,589 | $19,310 | $2,232 | $17,078 |
| 2017 | $1,369 | $19,310 | $2,232 | $17,078 |
| 2016 | $1,254 | $17,098 | $2,468 | $14,630 |
| 2015 | $1,244 | $17,100 | $2,470 | $14,630 |
| 2014 | $1,124 | $14,950 | $2,470 | $12,480 |
Source: Public Records
Map
Nearby Homes
- 2240 Delia Ct
- 707 22nd St SW
- 913 21st St SW
- 2139 Donna Ct
- 2318 S Colorado Ave
- 1918 Cindy Ct
- 1191 23rd St SW
- 527 24th Place SW
- 1902 Diana Dr
- 2120 S Taft Ave
- 1101 20th St SW
- 1417 Glenda Ct
- 1687 Valency Dr
- 1679 Valency Dr
- 0 SW 14th St Unit 949960
- 1673 Valency Dr
- 2112 Arron Dr
- 228 Courtney Dr
- 220 12th St SW Unit 125
- 214 Sierra Vista Dr