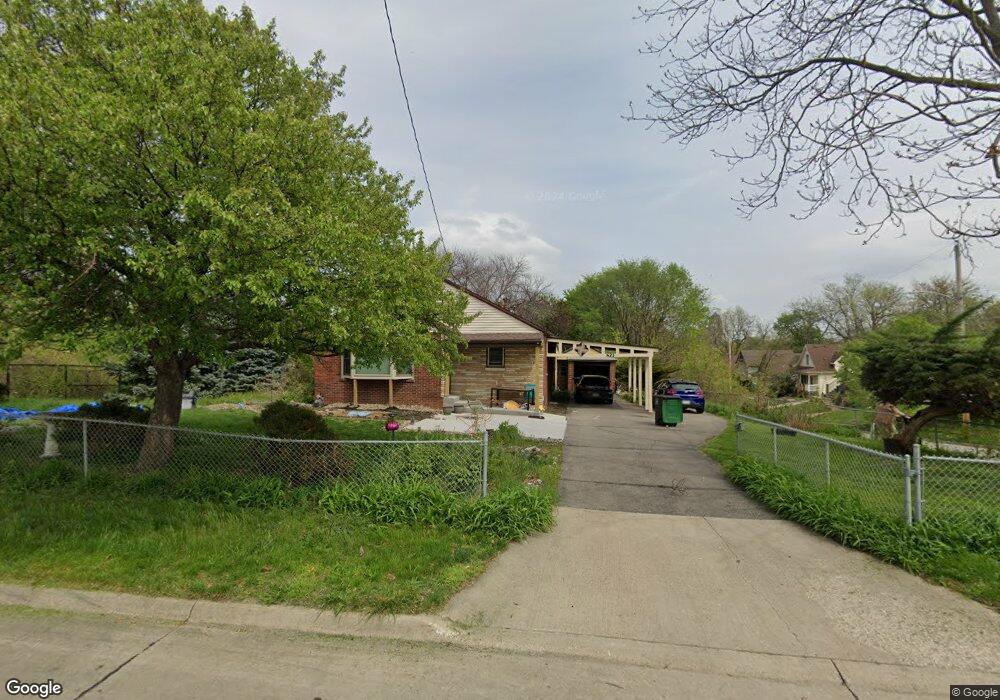
821 28th St Des Moines, IA 50312
Woodland Heights NeighborhoodEstimated Value: $220,000 - $240,000
2
Beds
2
Baths
1,141
Sq Ft
$203/Sq Ft
Est. Value
About This Home
This home is located at 821 28th St, Des Moines, IA 50312 and is currently estimated at $231,813, approximately $203 per square foot. 821 28th St is a home located in Polk County with nearby schools including Greenwood Elementary School and Roosevelt High School.
Ownership History
Date
Name
Owned For
Owner Type
Purchase Details
Closed on
Aug 18, 2020
Sold by
Melone Steven L and Turley Betty J
Bought by
Melone Steven L and Turley Betty J
Current Estimated Value
Purchase Details
Closed on
Jan 18, 2007
Sold by
Spencer Barbara M and Hogan Frank
Bought by
Melone Steven L and Turley Betty J
Home Financials for this Owner
Home Financials are based on the most recent Mortgage that was taken out on this home.
Original Mortgage
$125,000
Interest Rate
6.16%
Mortgage Type
Purchase Money Mortgage
Purchase Details
Closed on
Jun 18, 1999
Sold by
Hogan Frank Wesley and Hogan Bertie M
Bought by
Spencer Barbara M and Hogan Frank
Create a Home Valuation Report for This Property
The Home Valuation Report is an in-depth analysis detailing your home's value as well as a comparison with similar homes in the area
Home Values in the Area
Average Home Value in this Area
Purchase History
| Date | Buyer | Sale Price | Title Company |
|---|---|---|---|
| Melone Steven L | $500 | None Available | |
| Melone Steven L | $124,500 | None Available | |
| Spencer Barbara M | -- | -- |
Source: Public Records
Mortgage History
| Date | Status | Borrower | Loan Amount |
|---|---|---|---|
| Previous Owner | Melone Steven L | $125,000 |
Source: Public Records
Tax History Compared to Growth
Tax History
| Year | Tax Paid | Tax Assessment Tax Assessment Total Assessment is a certain percentage of the fair market value that is determined by local assessors to be the total taxable value of land and additions on the property. | Land | Improvement |
|---|---|---|---|---|
| 2025 | $4,084 | $244,000 | $43,700 | $200,300 |
| 2024 | $4,084 | $218,100 | $38,500 | $179,600 |
| 2023 | $3,812 | $218,100 | $38,500 | $179,600 |
| 2022 | $3,780 | $170,600 | $31,400 | $139,200 |
| 2021 | $3,600 | $170,600 | $31,400 | $139,200 |
| 2020 | $3,736 | $152,900 | $28,000 | $124,900 |
| 2019 | $3,442 | $152,900 | $28,000 | $124,900 |
| 2018 | $3,402 | $136,600 | $24,500 | $112,100 |
| 2017 | $3,316 | $136,600 | $24,500 | $112,100 |
| 2016 | $3,224 | $131,100 | $23,100 | $108,000 |
| 2015 | $3,224 | $131,100 | $23,100 | $108,000 |
| 2014 | $2,968 | $124,800 | $21,700 | $103,100 |
Source: Public Records
Map
Nearby Homes
- 2701 Rollins Ave
- 815 28th St
- 2706 Rollins Ave
- 2629 Rollins Ave
- 2700 Rollins Ave
- 2625 Rollins Ave
- 830 28th St
- 2630 Rollins Ave
- 824 28th St
- 2624 Rollins Ave
- 2815 Rollins Ave
- 820 28th St
- 2719 Center St
- 801 28th St
- 2621 Rollins Ave
- 2707 Center St
- 816 28th St
- 2622 Rollins Ave
- 2703 Center St
- 2625 Center St