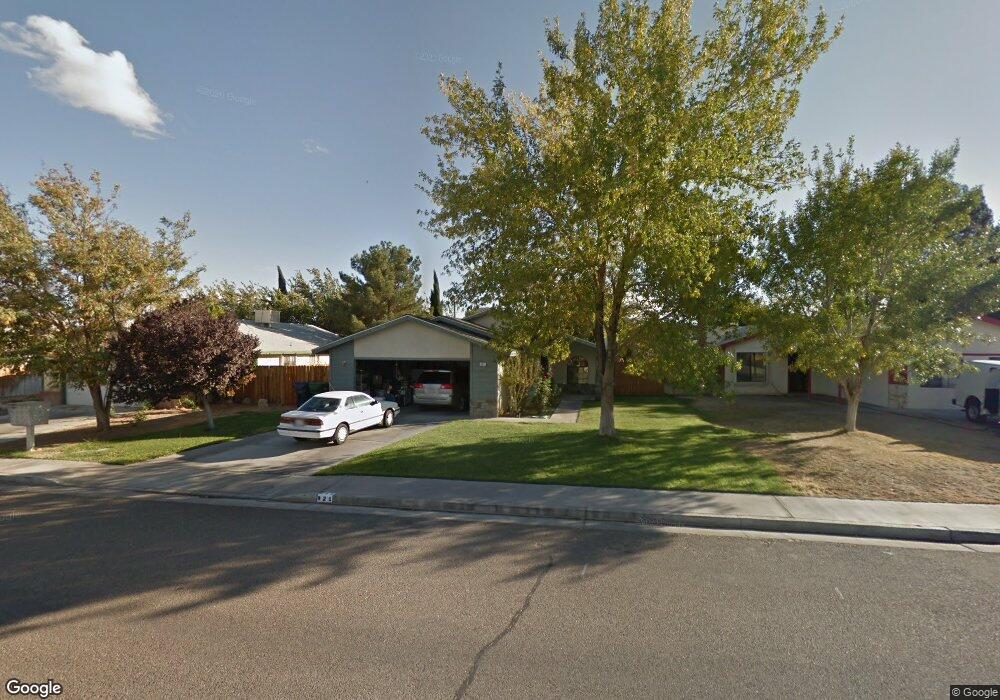
821 Charles Ct Ridgecrest, CA 93555
Estimated Value: $240,403 - $262,000
3
Beds
2
Baths
1,255
Sq Ft
$200/Sq Ft
Est. Value
About This Home
This home is located at 821 Charles Ct, Ridgecrest, CA 93555 and is currently estimated at $250,851, approximately $199 per square foot. 821 Charles Ct is a home located in Kern County with nearby schools including Faller Elementary School, James Monroe Middle School, and Burroughs High School.
Create a Home Valuation Report for This Property
The Home Valuation Report is an in-depth analysis detailing your home's value as well as a comparison with similar homes in the area
Home Values in the Area
Average Home Value in this Area
Tax History
| Year | Tax Paid | Tax Assessment Tax Assessment Total Assessment is a certain percentage of the fair market value that is determined by local assessors to be the total taxable value of land and additions on the property. | Land | Improvement |
|---|---|---|---|---|
| 2025 | $2,211 | $160,307 | $34,247 | $126,060 |
| 2024 | $2,147 | $157,165 | $33,576 | $123,589 |
| 2023 | $2,147 | $154,084 | $32,918 | $121,166 |
| 2022 | $2,103 | $151,064 | $32,273 | $118,791 |
| 2021 | $2,031 | $148,103 | $31,641 | $116,462 |
| 2020 | $1,981 | $146,585 | $31,317 | $115,268 |
| 2019 | $1,949 | $146,585 | $31,317 | $115,268 |
| 2018 | $1,914 | $140,894 | $30,101 | $110,793 |
| 2017 | $1,908 | $138,132 | $29,511 | $108,621 |
| 2016 | $1,834 | $135,425 | $28,933 | $106,492 |
| 2015 | $1,423 | $98,000 | $25,000 | $73,000 |
| 2014 | $1,635 | $128,000 | $32,000 | $96,000 |
Source: Public Records
Map
Nearby Homes
- 0 W Langley Ave Unit NDP2601440
- 1320 W Saint George Ave
- 0 W Saint George Ave
- 1012 W Langley Ave
- 341 S Gordon St
- 428 Thomas St
- 424 S Inyo St
- 417 S Inyo St
- 0 W Coronado Ave Unit 25003301
- 0 W Coronado Ave Unit SR25097540
- 1029 W Mariposa Ave
- 600 S Allen St
- 509-090-30 Bowman Rd
- 343-351-01 Bowman Rd
- 343-351-07 Bowman Rd
- 529 W Church Ave
- 1217 W Upjohn Ave
- 0 S Yorktown St
- 429 Dewalt Ave
- 421 Petris Ave
- 825 Charles Ct
- 817 Charles Ct Unit B
- 820 Janelle Ct
- 824 Janelle Ct
- 813 Charles Ct
- 816 Janelle Ct Unit C
- 0 Place 829 Charles Ct Unit 7886632-11783766
- 829 Charles Ct Unit B
- 812 Janelle Ct Unit C
- 828 Janelle Ct
- 820 Charles Ct
- 824 Charles Ct
- 809 Charles Ct
- 816 Charles Ct
- 812 Charles Ct
- 808 Janelle Ct
- 828 Charles Ct
- 832 Charles Ct Unit B
- 832 Janelle Ct Unit C
- 805 Charles Ct Unit B
Your Personal Tour Guide
Ask me questions while you tour the home.