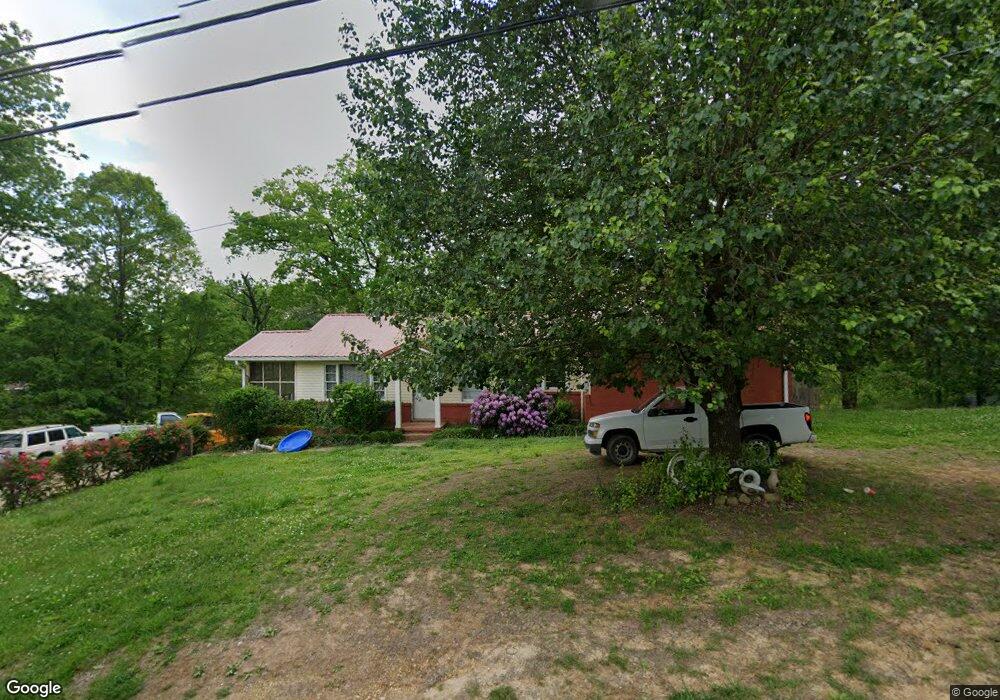
821 Cherokee Trail Rossville, GA 30741
Estimated Value: $219,000 - $292,855
3
Beds
3
Baths
2,960
Sq Ft
$82/Sq Ft
Est. Value
About This Home
This home is located at 821 Cherokee Trail, Rossville, GA 30741 and is currently estimated at $243,214, approximately $82 per square foot. 821 Cherokee Trail is a home located in Walker County with nearby schools including Stone Creek Elementary School, Rossville Middle School, and Ridgeland High School.
Ownership History
Date
Name
Owned For
Owner Type
Purchase Details
Closed on
Jul 18, 2019
Sold by
Kelley Gracie A
Bought by
Kelley Gracie A and Bugh Thomas Daniel
Current Estimated Value
Purchase Details
Closed on
Jul 9, 2019
Sold by
Johnson Kenneth Lamar
Bought by
Patterson Bessie Katherine
Purchase Details
Closed on
Dec 4, 2006
Sold by
First Horizon Home Loan Co
Bought by
Johnson Kenneth L
Purchase Details
Closed on
Aug 1, 2006
Sold by
Cooper Patsy L
Bought by
First Horizon Home Loan Corp
Purchase Details
Closed on
Jan 27, 2005
Sold by
Roberts Evelene M
Bought by
Cooper Patsy L
Home Financials for this Owner
Home Financials are based on the most recent Mortgage that was taken out on this home.
Original Mortgage
$80,240
Interest Rate
5.14%
Mortgage Type
New Conventional
Purchase Details
Closed on
Dec 26, 1980
Sold by
Calsaw Zuernie
Bought by
Calsaw Evelle M
Purchase Details
Closed on
Jan 1, 1972
Bought by
Calsaw Zuernie
Create a Home Valuation Report for This Property
The Home Valuation Report is an in-depth analysis detailing your home's value as well as a comparison with similar homes in the area
Home Values in the Area
Average Home Value in this Area
Purchase History
| Date | Buyer | Sale Price | Title Company |
|---|---|---|---|
| Kelley Gracie A | -- | -- | |
| Patterson Bessie Katherine | -- | -- | |
| Johnson Kenneth L | -- | -- | |
| First Horizon Home Loan Corp | -- | -- | |
| Cooper Patsy L | $100,300 | -- | |
| Calsaw Evelle M | -- | -- | |
| Calsaw Zuernie | -- | -- |
Source: Public Records
Mortgage History
| Date | Status | Borrower | Loan Amount |
|---|---|---|---|
| Previous Owner | Cooper Patsy L | $80,240 | |
| Previous Owner | Cooper Patsy L | $20,060 |
Source: Public Records
Tax History Compared to Growth
Tax History
| Year | Tax Paid | Tax Assessment Tax Assessment Total Assessment is a certain percentage of the fair market value that is determined by local assessors to be the total taxable value of land and additions on the property. | Land | Improvement |
|---|---|---|---|---|
| 2024 | $1,620 | $71,551 | $12,190 | $59,361 |
| 2023 | $620 | $19,936 | $7,314 | $12,622 |
| 2022 | $566 | $17,987 | $7,314 | $10,673 |
| 2021 | $471 | $12,542 | $4,876 | $7,666 |
| 2020 | $465 | $11,866 | $4,876 | $6,990 |
| 2019 | $472 | $11,896 | $4,906 | $6,990 |
| 2018 | $315 | $11,896 | $4,906 | $6,990 |
| 2017 | $678 | $19,468 | $4,906 | $14,562 |
| 2016 | $866 | $32,076 | $4,906 | $27,170 |
| 2015 | $979 | $34,602 | $4,872 | $29,730 |
| 2014 | $888 | $34,602 | $4,872 | $29,730 |
| 2013 | -- | $34,602 | $4,872 | $29,730 |
Source: Public Records
Map
Nearby Homes
- 820 Cherokee Trail
- 822 Cherokee Trail
- 814 Lynn Ln
- 824 Cherokee Trail
- 1407 Hillside Dr
- 834 Salem Rd
- 815 Cherokee Trail
- 832 Salem Rd
- 812 Lynn Ln
- 0 Hillside Dr Unit 7592763
- 0 Hillside Dr Unit 1241316
- 0 Hillside Dr Unit 1014393
- 906 Salem Rd
- 1405 Hillside Dr
- 822 Joyce Ln
- 815 Lynn Ln
- 902 Salem Rd
- 902 Salem Rd
- 813 Cherokee Trail
- 820 Joyce Ln