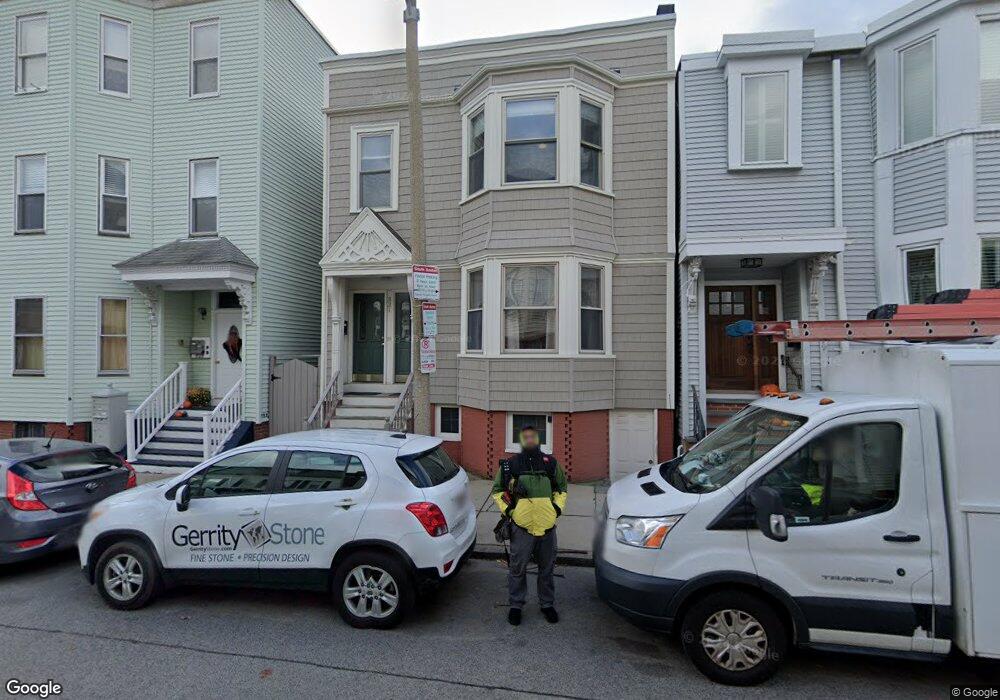
821 E 5th St Boston, MA 02127
South Boston NeighborhoodEstimated Value: $1,455,065 - $1,596,000
3
Beds
2
Baths
1,500
Sq Ft
$1,021/Sq Ft
Est. Value
About This Home
SPACIOUS EAST SIDE 3 BEDROOM/1 BATHROOM APARTMENT WITH BACK DECK AND COMMON YARD! APARTMENT FEATURES HARDWOOD FLOORS THROUGHOUT, LARGE KING PLUS SIZE BEDROOMS, FULLY APPLIANCED UPDATED EAT-IN KITCHEN, DESIGNATED DINING AREA, IN-UNIT LAUNDRY, BIG LIVING ROOM WITH SPIRAL STAIRCASE DOWN TO ADDITIONAL OFFICE/DEN. GREAT PRIVATE BACK DECK AND COMMON YARD PERFECT FOR SUMMERTIME ENTERTAINING. PREMIER CITY POINT LOCATION NEAR PARKS/BEACHES, CASTLE ISLAND, SEAPORT DISTRICT, PUBLIC TRANSPORTATION, AND ALL THE NEW SOUTHIE SHOPS, BARS & RESTAURANTS.
Ownership History
Date
Name
Owned For
Owner Type
Purchase Details
Closed on
Oct 11, 2007
Sold by
Christian Kathleen P and Christian Paul A
Bought by
Christian Investment L
Current Estimated Value
Create a Home Valuation Report for This Property
The Home Valuation Report is an in-depth analysis detailing your home's value as well as a comparison with similar homes in the area
Home Values in the Area
Average Home Value in this Area
Purchase History
| Date | Buyer | Sale Price | Title Company |
|---|---|---|---|
| Christian Investment L | -- | -- |
Source: Public Records
Property History
| Date | Event | Price | List to Sale | Price per Sq Ft |
|---|---|---|---|---|
| 09/01/2024 09/01/24 | For Rent | $4,500 | -- | -- |
Tax History
| Year | Tax Paid | Tax Assessment Tax Assessment Total Assessment is a certain percentage of the fair market value that is determined by local assessors to be the total taxable value of land and additions on the property. | Land | Improvement |
|---|---|---|---|---|
| 2025 | $14,077 | $1,215,600 | $470,800 | $744,800 |
| 2024 | $13,731 | $1,259,700 | $426,100 | $833,600 |
| 2023 | $12,529 | $1,166,600 | $394,600 | $772,000 |
| 2022 | $11,747 | $1,079,700 | $365,200 | $714,500 |
| 2021 | $11,295 | $1,058,600 | $358,100 | $700,500 |
| 2020 | $10,832 | $1,025,800 | $311,800 | $714,000 |
| 2019 | $10,603 | $1,006,000 | $240,600 | $765,400 |
| 2018 | $10,037 | $957,700 | $240,600 | $717,100 |
| 2017 | $9,220 | $870,600 | $240,600 | $630,000 |
| 2016 | $8,707 | $791,500 | $240,600 | $550,900 |
| 2015 | $7,812 | $645,100 | $210,600 | $434,500 |
| 2014 | $6,908 | $549,100 | $210,600 | $338,500 |
Source: Public Records
Map
Nearby Homes
- 786 E 6th St Unit 788
- 755 E 5th St Unit 757
- 33 Lennon Ct Unit 39
- 885 E Broadway
- 901 E Broadway Unit 1
- 840 E 4th St Unit 1
- 722 E 5th St Unit TH
- 861 E Broadway
- 1 Twomey Ct Unit 40
- 933 E Broadway
- 137 N St Unit 3
- 722 E 6th St
- 703 E 5th St Unit 1
- 838 E Broadway Unit 7
- 38 P St Unit 3
- 862 E 2nd St Unit 6
- 37 Farragut Rd Unit 7
- 37 Farragut Rd Unit 6
- 37 Farragut Rd Unit Four
- 37 Farragut Rd Unit 3
Your Personal Tour Guide
Ask me questions while you tour the home.