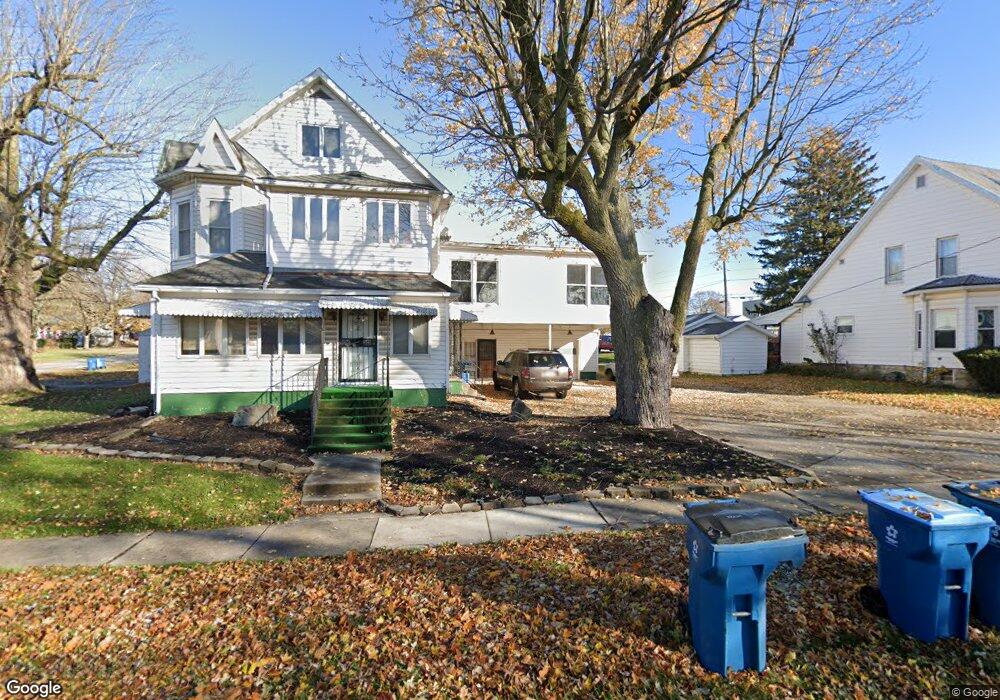
821 E Franklin St Unit 821 1/2 Kenton, OH 43326
Estimated Value: $144,000 - $153,000
7
Beds
3
Baths
4,653
Sq Ft
$32/Sq Ft
Est. Value
About This Home
This home is located at 821 E Franklin St Unit 821 1/2, Kenton, OH 43326 and is currently estimated at $148,500, approximately $31 per square foot. 821 E Franklin St Unit 821 1/2 is a home located in Hardin County with nearby schools including Kenton Elementary School, Kenton Middle School, and Kenton High School.
Ownership History
Date
Name
Owned For
Owner Type
Purchase Details
Closed on
Jun 1, 2021
Sold by
Oborn C Craig C and Oborn Kathryn M
Bought by
Howell Corey J and Howell Tara L
Current Estimated Value
Home Financials for this Owner
Home Financials are based on the most recent Mortgage that was taken out on this home.
Original Mortgage
$153,066
Outstanding Balance
$127,516
Interest Rate
2.9%
Mortgage Type
New Conventional
Estimated Equity
$20,984
Purchase Details
Closed on
Sep 29, 2016
Sold by
Oborn C Craig
Bought by
Oborn Craig and Oborn Kathryn M
Purchase Details
Closed on
Sep 15, 1999
Bought by
Oborn Wilma J
Purchase Details
Closed on
Jun 5, 1997
Bought by
Oborn Wilma J
Purchase Details
Closed on
Dec 5, 1991
Purchase Details
Closed on
Oct 16, 1986
Create a Home Valuation Report for This Property
The Home Valuation Report is an in-depth analysis detailing your home's value as well as a comparison with similar homes in the area
Home Values in the Area
Average Home Value in this Area
Purchase History
| Date | Buyer | Sale Price | Title Company |
|---|---|---|---|
| Howell Corey J | $75,000 | None Available | |
| Howell Corey J | -- | None Listed On Document | |
| Oborn Craig | -- | None Available | |
| Oborn Wilma J | -- | -- | |
| Oborn Wilma J | -- | -- | |
| -- | -- | -- | |
| -- | -- | -- |
Source: Public Records
Mortgage History
| Date | Status | Borrower | Loan Amount |
|---|---|---|---|
| Open | Howell Corey J | $153,066 |
Source: Public Records
Tax History Compared to Growth
Tax History
| Year | Tax Paid | Tax Assessment Tax Assessment Total Assessment is a certain percentage of the fair market value that is determined by local assessors to be the total taxable value of land and additions on the property. | Land | Improvement |
|---|---|---|---|---|
| 2024 | $2,170 | $48,240 | $4,000 | $44,240 |
| 2023 | $2,170 | $48,240 | $4,000 | $44,240 |
| 2022 | $2,467 | $51,570 | $3,000 | $48,570 |
| 2021 | $2,476 | $51,570 | $3,000 | $48,570 |
| 2020 | $2,158 | $51,570 | $3,000 | $48,570 |
| 2019 | $1,719 | $42,170 | $2,860 | $39,310 |
| 2018 | $1,721 | $42,170 | $2,860 | $39,310 |
| 2017 | $854 | $42,170 | $2,860 | $39,310 |
| 2016 | $1,573 | $40,800 | $4,070 | $36,730 |
| 2015 | $1,468 | $40,800 | $4,070 | $36,730 |
| 2014 | $611 | $40,800 | $4,070 | $36,730 |
| 2013 | $676 | $42,980 | $4,070 | $38,910 |
Source: Public Records
Map
Nearby Homes
- 115 Scioto St
- 79 Broadway St
- 920 Cooper St
- 39 Grape St
- 530 E Franklin St
- 513 E Franklin St
- 510 Decatur St
- 508 Decatur St
- 1 C Ct
- 509 E Carrol St
- 121 S High St
- 0 N Barron St
- 503 Jennings St
- 639 S Main St
- 215 N Main St
- 416 N Cherry St
- 233 N Main St
- 416 E Eliza St
- 324 Stone Hedge Ln Unit 324
- 727 S Detroit St