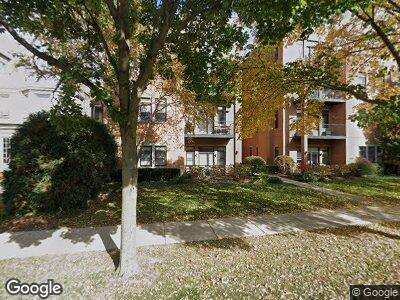
821 Foster St Unit 8213N Evanston, IL 60201
Northeast Evanston NeighborhoodEstimated Value: $498,000 - $636,000
2
Beds
--
Bath
1,300
Sq Ft
$431/Sq Ft
Est. Value
About This Home
This home is located at 821 Foster St Unit 8213N, Evanston, IL 60201 and is currently estimated at $559,900, approximately $430 per square foot. 821 Foster St Unit 8213N is a home located in Cook County with nearby schools including Dewey Elementary School, Washington Elementary School, and Nichols Middle School.
Ownership History
Date
Name
Owned For
Owner Type
Purchase Details
Closed on
Oct 14, 2022
Sold by
Domenjoud Ivy
Bought by
Berousek David J and Beroursek Janice H
Current Estimated Value
Purchase Details
Closed on
Sep 21, 2006
Sold by
Kim Hyunsuk and Kim Sharon
Bought by
Domenjoud Ivy
Home Financials for this Owner
Home Financials are based on the most recent Mortgage that was taken out on this home.
Original Mortgage
$342,400
Interest Rate
7.25%
Mortgage Type
Unknown
Purchase Details
Closed on
May 6, 2005
Sold by
Foster Street Development Llc
Bought by
Kim Hyunsuk and Lee Sharon
Home Financials for this Owner
Home Financials are based on the most recent Mortgage that was taken out on this home.
Original Mortgage
$317,340
Interest Rate
4.45%
Mortgage Type
Unknown
Create a Home Valuation Report for This Property
The Home Valuation Report is an in-depth analysis detailing your home's value as well as a comparison with similar homes in the area
Home Values in the Area
Average Home Value in this Area
Purchase History
| Date | Buyer | Sale Price | Title Company |
|---|---|---|---|
| Berousek David J | $480,000 | None Listed On Document | |
| Domenjoud Ivy | $428,000 | Ticor Title Insurance Compan | |
| Kim Hyunsuk | $397,000 | Git |
Source: Public Records
Mortgage History
| Date | Status | Borrower | Loan Amount |
|---|---|---|---|
| Previous Owner | Domenjoud Ivy | $287,000 | |
| Previous Owner | Domenjoud Ivy | $319,200 | |
| Previous Owner | Domenjoud Ivy | $345,000 | |
| Previous Owner | Domenjoud Ivy | $342,400 | |
| Previous Owner | Kim Hyunsuk | $317,340 |
Source: Public Records
Tax History Compared to Growth
Tax History
| Year | Tax Paid | Tax Assessment Tax Assessment Total Assessment is a certain percentage of the fair market value that is determined by local assessors to be the total taxable value of land and additions on the property. | Land | Improvement |
|---|---|---|---|---|
| 2024 | $10,157 | $49,883 | $3,207 | $46,676 |
| 2023 | $10,157 | $49,883 | $3,207 | $46,676 |
| 2022 | $10,157 | $49,883 | $3,207 | $46,676 |
| 2021 | $8,561 | $38,254 | $2,116 | $36,138 |
| 2020 | $10,016 | $38,254 | $2,116 | $36,138 |
| 2019 | $9,802 | $41,835 | $2,116 | $39,719 |
| 2018 | $9,579 | $34,964 | $1,795 | $33,169 |
| 2017 | $9,329 | $34,964 | $1,795 | $33,169 |
| 2016 | $7,765 | $34,964 | $1,795 | $33,169 |
| 2015 | $7,292 | $29,817 | $1,539 | $28,278 |
| 2014 | $7,237 | $29,817 | $1,539 | $28,278 |
| 2013 | $7,054 | $29,817 | $1,539 | $28,278 |
Source: Public Records
Map
Nearby Homes
- 2025 Sherman Ave Unit 401
- 1935 Sherman Ave Unit 2N
- 1935 Sherman Ave Unit 1N
- 1923 Sherman Ave Unit 1N
- 2024 Maple Ave
- 709 Foster St
- 1942 Orrington Ave
- 2036 Orrington Ave
- 1862 Sherman Ave Unit 7SE
- 1864 Sherman Ave Unit 5NW
- 1860 Sherman Ave Unit 7NE
- 730 Noyes St Unit K3
- 800 Elgin Rd Unit PH08
- 800 Elgin Rd Unit 1
- 800 Elgin Rd Unit 1314
- 800 Elgin Rd Unit 1502
- 718 Noyes St Unit A2
- 734 Noyes St Unit L1
- 720 Noyes St Unit C2
- 1105 Leonard Place
- 821 Foster St Unit 8211N
- 821 Foster St Unit 8212S
- 821 Foster St Unit 8213N
- 821 Foster St Unit 8214N
- 821 Foster St Unit 8213S
- 821 Foster St Unit 8212N
- 821 Foster St Unit 8211S
- 821 Foster St Unit 1N
- 821 Foster St Unit 2S
- 821 Foster St Unit 2-S
- 821 Foster St Unit 1S
- 821 Foster St Unit 4N
- 821 Foster St Unit 3N
- 821 Foster St Unit 3N
- 821 Foster St Unit 3S
- 819 Foster St Unit 1N
- 819 Foster St Unit 3N
- 819 Foster St Unit 3S
- 819 Foster St Unit 8192N
- 819 Foster St Unit 8191S