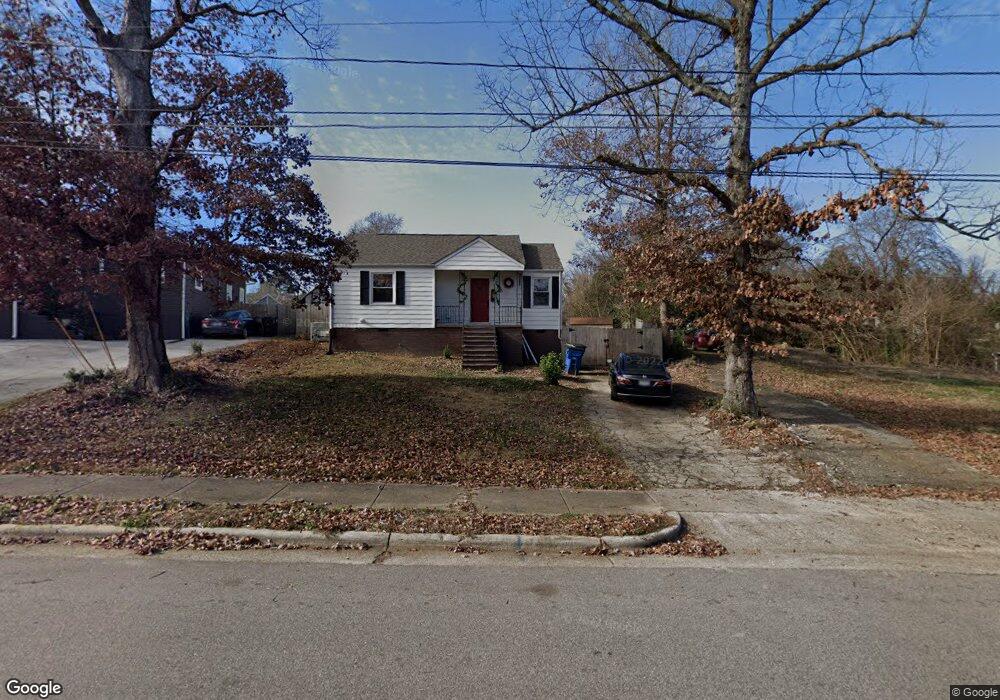
821 N King Charles Rd Raleigh, NC 27610
King Charles NeighborhoodEstimated Value: $329,000 - $476,718
2
Beds
1
Bath
779
Sq Ft
$525/Sq Ft
Est. Value
About This Home
This home is located at 821 N King Charles Rd, Raleigh, NC 27610 and is currently estimated at $408,930, approximately $524 per square foot. 821 N King Charles Rd is a home located in Wake County with nearby schools including Underwood Magnet Elementary School, Leroy Martin Magnet, and Enloe High.
Ownership History
Date
Name
Owned For
Owner Type
Purchase Details
Closed on
Jul 29, 2020
Sold by
Lang Matthew
Bought by
Burns Abigail M
Current Estimated Value
Purchase Details
Closed on
Jan 25, 2017
Sold by
Alexieff Amalia
Bought by
Lang Matthew
Home Financials for this Owner
Home Financials are based on the most recent Mortgage that was taken out on this home.
Original Mortgage
$121,600
Interest Rate
4.16%
Mortgage Type
New Conventional
Purchase Details
Closed on
Jan 30, 2015
Sold by
Cea Richard
Bought by
Alexieff Amalia
Purchase Details
Closed on
Jun 18, 1998
Sold by
Barakat Najib and Barakat Roxan
Bought by
Cea Richard
Home Financials for this Owner
Home Financials are based on the most recent Mortgage that was taken out on this home.
Original Mortgage
$51,700
Interest Rate
7.14%
Create a Home Valuation Report for This Property
The Home Valuation Report is an in-depth analysis detailing your home's value as well as a comparison with similar homes in the area
Home Values in the Area
Average Home Value in this Area
Purchase History
| Date | Buyer | Sale Price | Title Company |
|---|---|---|---|
| Burns Abigail M | $200,000 | None Available | |
| Lang Matthew | $152,000 | None Available | |
| Alexieff Amalia | $79,000 | None Available | |
| Cea Richard | $57,500 | Commonwealth Land Title |
Source: Public Records
Mortgage History
| Date | Status | Borrower | Loan Amount |
|---|---|---|---|
| Previous Owner | Lang Matthew | $121,600 | |
| Previous Owner | Cea Richard | $51,700 |
Source: Public Records
Tax History Compared to Growth
Tax History
| Year | Tax Paid | Tax Assessment Tax Assessment Total Assessment is a certain percentage of the fair market value that is determined by local assessors to be the total taxable value of land and additions on the property. | Land | Improvement |
|---|---|---|---|---|
| 2025 | $3,793 | $432,616 | $180,000 | $252,616 |
| 2024 | $3,777 | $432,616 | $180,000 | $252,616 |
| 2023 | $2,973 | $270,922 | $103,500 | $167,422 |
| 2022 | $2,723 | $266,942 | $103,500 | $163,442 |
| 2021 | $1,523 | $154,420 | $103,500 | $50,920 |
| 2020 | $1,495 | $154,420 | $103,500 | $50,920 |
| 2019 | $964 | $81,472 | $43,200 | $38,272 |
| 2018 | $910 | $81,472 | $43,200 | $38,272 |
| 2017 | $868 | $81,472 | $43,200 | $38,272 |
| 2016 | $850 | $81,472 | $43,200 | $38,272 |
| 2015 | -- | $74,823 | $28,000 | $46,823 |
| 2014 | $755 | $74,823 | $28,000 | $46,823 |
Source: Public Records
Map
Nearby Homes
- 709 Brighton Rd
- 707 Colleton Rd
- 1105 Glascock St Unit 101 & 102
- 1105 Glascock St Unit 101
- 2040 Milburnie Rd
- 1000 Addison Place Unit 101
- 1000 Addison Place Unit 102
- 509 Colleton Rd
- 1016 Addison Place
- 2318 Glascock St
- 1012 Addison Place
- 2325 Sheffield Rd Unit 102
- 2302 Derby Dr
- 1005 Phoenix Place
- 2331 Kennington Rd
- 1001 Phoenix Place
- 408 Locke Ln
- 1421 Lions Way
- 2201 Millbank Village Ct Unit 101
- 2309 Bertie Dr
- 817 N King Charles Rd
- 825 N King Charles Rd
- 808 Hartford Rd
- 813 N King Charles Rd
- 812 Hartford Rd
- 804 Hartford Rd
- 800 Hartford Rd
- 2118 Sheffield Rd
- 2122 Sheffield Rd
- 712 Hartford Rd
- 824 N King Charles Rd
- 820 N King Charles Rd
- 814 Hartford Rd
- 842 N King Charles Rd
- 809 N King Charles Rd
- 708 Hartford Rd
- 816 N King Charles Rd
- 2200 Sheffield Rd
- 704 Hartford Rd
- 812 N King Charles Rd