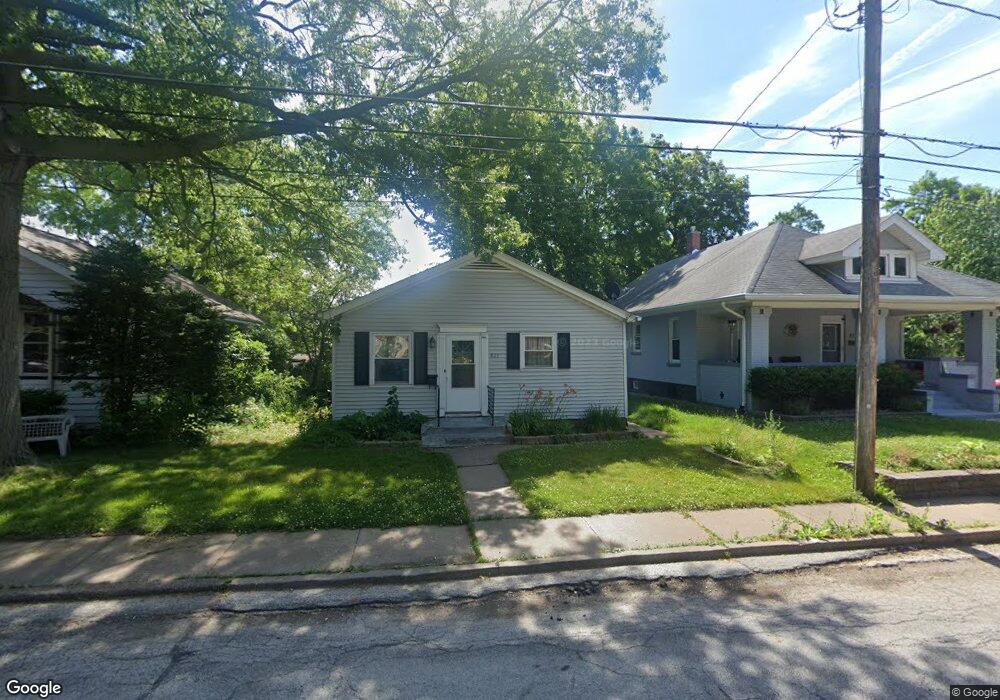
821 N Pine St Davenport, IA 52804
West End NeighborhoodEstimated Value: $116,000 - $143,000
2
Beds
2
Baths
884
Sq Ft
$140/Sq Ft
Est. Value
About This Home
This home is located at 821 N Pine St, Davenport, IA 52804 and is currently estimated at $123,924, approximately $140 per square foot. 821 N Pine St is a home located in Scott County with nearby schools including Walnut Hill Elementary School, South Christian Elementary School, and Wilson Elementary School.
Ownership History
Date
Name
Owned For
Owner Type
Purchase Details
Closed on
Mar 15, 2021
Sold by
Wendel Synthia J
Bought by
Wendel Jeff J and Wendel Synthia J
Current Estimated Value
Purchase Details
Closed on
Jul 30, 2013
Sold by
The Secretary Of Hud Of Washington D C
Bought by
Wendel Synthia J
Home Financials for this Owner
Home Financials are based on the most recent Mortgage that was taken out on this home.
Original Mortgage
$72,162
Outstanding Balance
$52,495
Interest Rate
3.93%
Mortgage Type
New Conventional
Estimated Equity
$71,429
Purchase Details
Closed on
Sep 11, 2012
Sold by
Meade Ronald
Bought by
Nationwide Advantage Mortgage Company
Purchase Details
Closed on
Aug 22, 2008
Sold by
Lester Lisa
Bought by
Meade Ronald T
Home Financials for this Owner
Home Financials are based on the most recent Mortgage that was taken out on this home.
Original Mortgage
$88,729
Interest Rate
6.42%
Mortgage Type
FHA
Create a Home Valuation Report for This Property
The Home Valuation Report is an in-depth analysis detailing your home's value as well as a comparison with similar homes in the area
Home Values in the Area
Average Home Value in this Area
Purchase History
| Date | Buyer | Sale Price | Title Company |
|---|---|---|---|
| Wendel Jeff J | -- | None Available | |
| Wendel Synthia J | -- | None Available | |
| Nationwide Advantage Mortgage Company | $100,177 | None Available | |
| Meade Ronald T | $90,000 | None Available |
Source: Public Records
Mortgage History
| Date | Status | Borrower | Loan Amount |
|---|---|---|---|
| Open | Wendel Synthia J | $72,162 | |
| Previous Owner | Meade Ronald T | $88,729 |
Source: Public Records
Tax History Compared to Growth
Tax History
| Year | Tax Paid | Tax Assessment Tax Assessment Total Assessment is a certain percentage of the fair market value that is determined by local assessors to be the total taxable value of land and additions on the property. | Land | Improvement |
|---|---|---|---|---|
| 2025 | $1,592 | $95,180 | $9,800 | $85,380 |
| 2024 | $1,554 | $89,080 | $9,800 | $79,280 |
| 2023 | $1,775 | $89,080 | $9,800 | $79,280 |
| 2022 | $1,718 | $80,060 | $9,800 | $70,260 |
| 2021 | $1,718 | $80,060 | $9,800 | $70,260 |
| 2020 | $1,410 | $71,630 | $9,800 | $61,830 |
| 2019 | $1,290 | $66,010 | $9,800 | $56,210 |
| 2018 | $1,182 | $66,010 | $9,800 | $56,210 |
| 2017 | $348 | $62,500 | $9,800 | $52,700 |
| 2016 | $1,018 | $62,500 | $0 | $0 |
| 2015 | $1,018 | $61,490 | $0 | $0 |
| 2014 | $866 | $61,490 | $0 | $0 |
| 2013 | $992 | $0 | $0 | $0 |
| 2012 | -- | $76,140 | $11,370 | $64,770 |
Source: Public Records
Map
Nearby Homes
- 926 Cimarron Dr
- 2114 Telegraph Rd
- 2024 W 6th St
- 2101 W 5th St
- 511 Waverly Rd
- 1107 N Thornwood Ave
- 2243 W 4th St
- 1119 N Thornwood Ave
- 1203 N Thornwood Ave
- 2449 W 13th St
- 1854 W 8th St
- 321 Cedar St
- 1824 W 8th St
- 211 Cedar St
- 120 N Pine St
- 2011 W 2nd St
- 2312 1/2 W 1st St
- 2312 W 1st St
- 1815 W 3rd St
- 2010 W 1st St
- 823 N Pine St
- 817 N Pine St
- 828 Belmont St
- 822 Belmont St
- 903 N Pine St
- 904 Belmont St
- 830 N Pine St
- 834 N Pine St
- 818 N Pine St
- 814 N Pine St
- 909 N Pine St
- 910 Belmont St
- 906 N Pine St
- 915 N Pine St
- 2114 Glaspell St
- 2108 Glaspell St
- 916 Belmont St
- 2104 Glaspell St
- 2015 Schricker St
- 2202 Newberry St