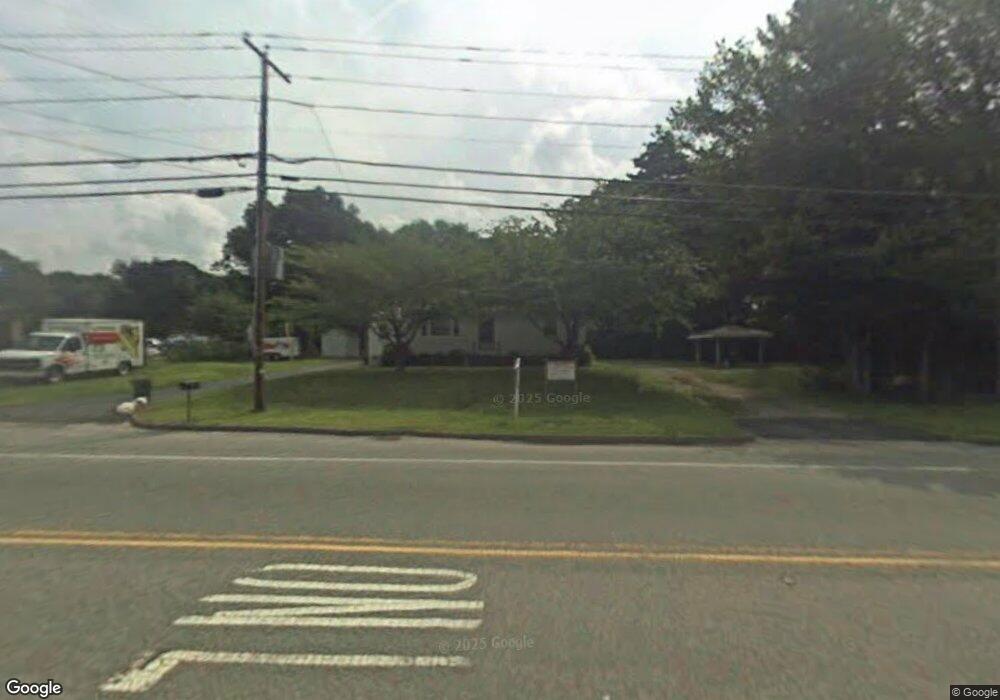
821 S Main St Bellingham, MA 02019
Estimated Value: $391,000 - $464,000
2
Beds
1
Bath
1,400
Sq Ft
$306/Sq Ft
Est. Value
About This Home
This home is located at 821 S Main St, Bellingham, MA 02019 and is currently estimated at $428,933, approximately $306 per square foot. 821 S Main St is a home located in Norfolk County with nearby schools including Joseph F. DiPietro Elementary, Bellingham High School, and Rise Prep Mayoral Academy Middle School.
Ownership History
Date
Name
Owned For
Owner Type
Purchase Details
Closed on
May 13, 1998
Sold by
Kalenkiewicz Juliette
Bought by
Gerrior Charles E and Gerrior Jeanne E
Current Estimated Value
Home Financials for this Owner
Home Financials are based on the most recent Mortgage that was taken out on this home.
Original Mortgage
$80,000
Outstanding Balance
$15,604
Interest Rate
7.08%
Mortgage Type
Purchase Money Mortgage
Estimated Equity
$413,329
Create a Home Valuation Report for This Property
The Home Valuation Report is an in-depth analysis detailing your home's value as well as a comparison with similar homes in the area
Home Values in the Area
Average Home Value in this Area
Purchase History
| Date | Buyer | Sale Price | Title Company |
|---|---|---|---|
| Gerrior Charles E | $125,000 | -- |
Source: Public Records
Mortgage History
| Date | Status | Borrower | Loan Amount |
|---|---|---|---|
| Open | Gerrior Charles E | $80,000 |
Source: Public Records
Tax History Compared to Growth
Tax History
| Year | Tax Paid | Tax Assessment Tax Assessment Total Assessment is a certain percentage of the fair market value that is determined by local assessors to be the total taxable value of land and additions on the property. | Land | Improvement |
|---|---|---|---|---|
| 2025 | $4,214 | $335,500 | $135,300 | $200,200 |
| 2024 | $4,043 | $314,400 | $123,500 | $190,900 |
| 2023 | $3,899 | $298,800 | $117,600 | $181,200 |
| 2022 | $3,744 | $265,900 | $98,100 | $167,800 |
| 2021 | $3,626 | $251,600 | $98,100 | $153,500 |
| 2020 | $3,410 | $239,800 | $98,100 | $141,700 |
| 2019 | $3,338 | $234,900 | $98,100 | $136,800 |
| 2018 | $3,141 | $218,000 | $99,000 | $119,000 |
| 2017 | $3,066 | $213,800 | $99,000 | $114,800 |
| 2016 | $3,011 | $210,700 | $102,900 | $107,800 |
| 2015 | $2,891 | $202,900 | $99,000 | $103,900 |
| 2014 | $2,885 | $196,800 | $95,500 | $101,300 |
Source: Public Records
Map
Nearby Homes
- 822 S Main St
- 818 S Main St
- 828 S Main St
- 826 S Main St
- 828 S Main St Unit B 828
- 826 S Main St Unit 826
- 829 S Main St Unit 2
- 829 S Main St
- 832 S Main St
- 810 S Main St
- 835 S Main St
- 833 S Main St
- 833 S Main St Unit 833
- 836 S Main St
- 823 S Main St Unit 827
- 838 S Main St
- 806 S Main St
- 802 S Main St
- 1 Penny Ln
- 2 Penny Ln