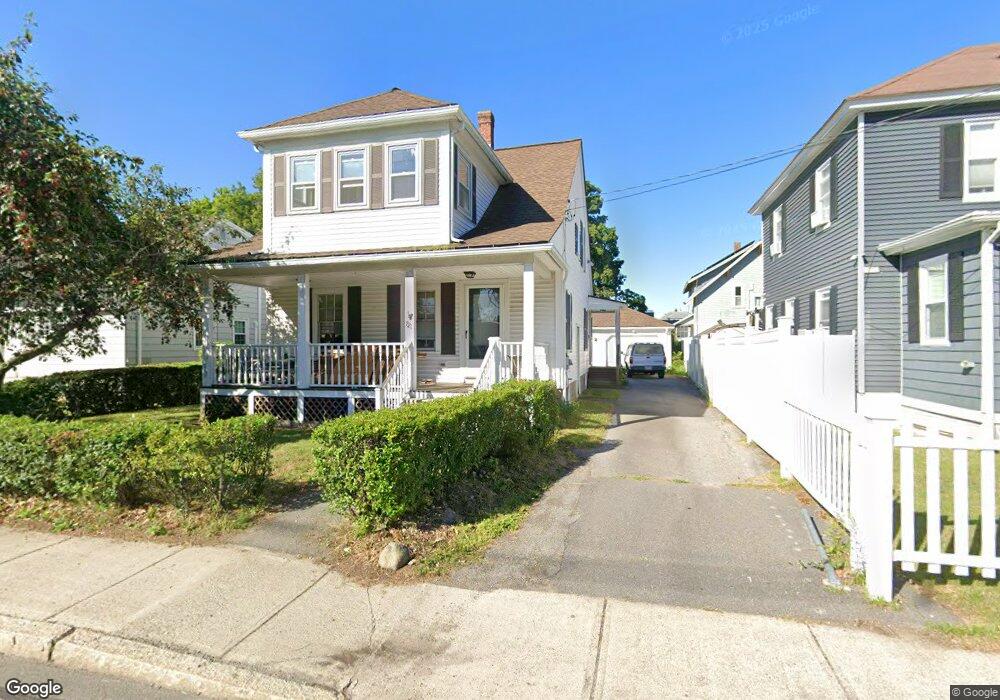
821 Stevens St Lowell, MA 01851
Highlands NeighborhoodEstimated Value: $486,000 - $575,000
3
Beds
1
Bath
1,384
Sq Ft
$374/Sq Ft
Est. Value
About This Home
This home is located at 821 Stevens St, Lowell, MA 01851 and is currently estimated at $517,390, approximately $373 per square foot. 821 Stevens St is a home located in Middlesex County with nearby schools including Dr. Gertrude Bailey Elementary School, Abraham Lincoln Elementary School, and Charles W. Morey Elementary School.
Ownership History
Date
Name
Owned For
Owner Type
Purchase Details
Closed on
Oct 3, 2024
Sold by
Levasseur John
Bought by
Levasseur Ft and Levasseur
Current Estimated Value
Purchase Details
Closed on
Feb 9, 2024
Sold by
Mccarron Joanne and Mccarron
Bought by
Levasseau John and Levasseur Joseph
Purchase Details
Closed on
Oct 14, 2016
Sold by
Levasseur Mildred A
Bought by
Mildred A Levasseur Lt and Levasseur
Create a Home Valuation Report for This Property
The Home Valuation Report is an in-depth analysis detailing your home's value as well as a comparison with similar homes in the area
Home Values in the Area
Average Home Value in this Area
Purchase History
| Date | Buyer | Sale Price | Title Company |
|---|---|---|---|
| Levasseur Ft | -- | None Available | |
| Levasseur Ft | -- | None Available | |
| Levasseau John | -- | None Available | |
| Levasseau John | -- | None Available | |
| Mccarron Joanne | -- | None Available | |
| Mildred A Levasseur Lt | -- | -- | |
| Mildred A Levasseur Lt | -- | -- |
Source: Public Records
Tax History
| Year | Tax Paid | Tax Assessment Tax Assessment Total Assessment is a certain percentage of the fair market value that is determined by local assessors to be the total taxable value of land and additions on the property. | Land | Improvement |
|---|---|---|---|---|
| 2025 | $5,091 | $443,500 | $181,600 | $261,900 |
| 2024 | $4,963 | $416,700 | $169,700 | $247,000 |
| 2023 | $4,658 | $375,000 | $147,600 | $227,400 |
| 2022 | $4,293 | $338,300 | $134,200 | $204,100 |
| 2021 | $4,002 | $297,300 | $116,700 | $180,600 |
| 2020 | $3,693 | $276,400 | $104,700 | $171,700 |
| 2019 | $3,513 | $250,200 | $103,800 | $146,400 |
| 2018 | $3,435 | $238,700 | $98,900 | $139,800 |
| 2017 | $3,405 | $228,200 | $95,800 | $132,400 |
| 2016 | $3,135 | $206,800 | $86,300 | $120,500 |
| 2015 | $3,065 | $198,000 | $86,300 | $111,700 |
| 2013 | $2,960 | $197,200 | $98,500 | $98,700 |
Source: Public Records
Map
Nearby Homes
- 138 W Forest St
- 108 Inland St
- 17 B St
- 37 Saint Paul St
- 525 Chelmsford St
- 64 Bradstreet Ave
- 4 Fern St
- 186 Powell St
- 255 Plain St
- 85 B St
- 20 Woodland Dr Unit 379
- 20 Woodland Dr Unit 376
- 37 Manning Rd
- 215 Chelmsford St Unit 18
- 28 Court St
- 6 Cottage Place
- 710 School St
- 131 London St
- 67 S Loring St
- 18 Burgess St
Your Personal Tour Guide
Ask me questions while you tour the home.