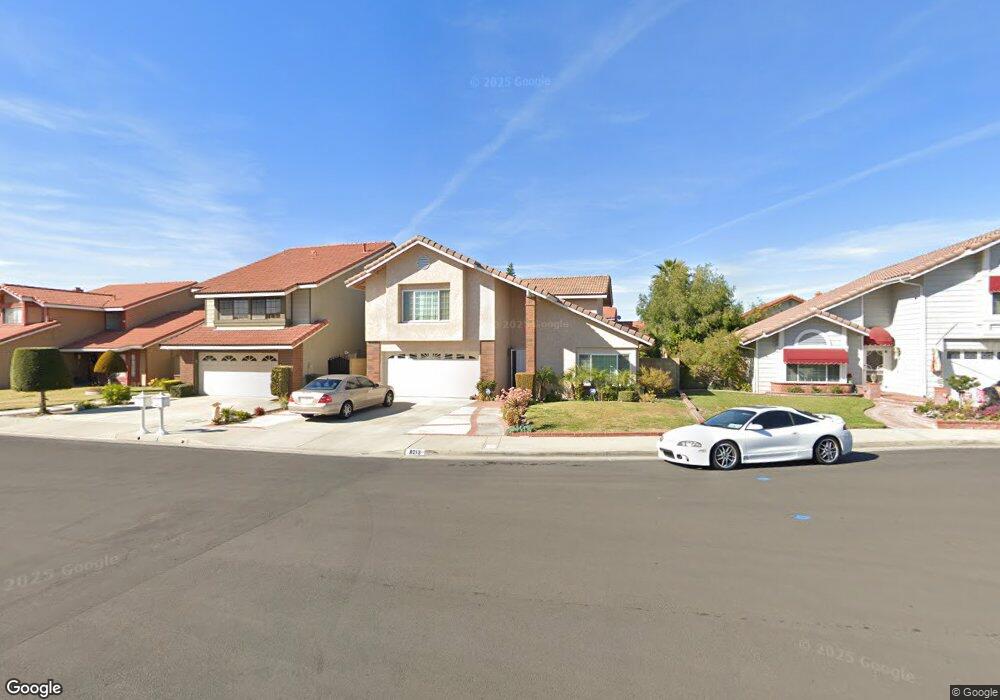
8213 Joshua Cir Buena Park, CA 90620
Estimated Value: $1,053,000 - $1,123,000
4
Beds
3
Baths
2,082
Sq Ft
$523/Sq Ft
Est. Value
About This Home
This home is located at 8213 Joshua Cir, Buena Park, CA 90620 and is currently estimated at $1,089,536, approximately $523 per square foot. 8213 Joshua Cir is a home located in Orange County with nearby schools including Glen H. Dysinger Sr. Elementary School, Dale Jr High School, and Savanna High School.
Ownership History
Date
Name
Owned For
Owner Type
Purchase Details
Closed on
Aug 5, 2018
Sold by
Bhasin Rakesh and Bhasin Anita
Bought by
Bhasin Rakesh and Bhasin Anita
Current Estimated Value
Purchase Details
Closed on
Sep 4, 2014
Sold by
Oxy Usa Inc
Bought by
Vintage Petroleum Inc
Purchase Details
Closed on
Aug 3, 2013
Sold by
Bhasin Rakesh and Bhasin Anita
Bought by
Bhasin Rakesh and Bhasin Anita
Home Financials for this Owner
Home Financials are based on the most recent Mortgage that was taken out on this home.
Original Mortgage
$200,000
Outstanding Balance
$49,992
Interest Rate
4.46%
Mortgage Type
New Conventional
Estimated Equity
$1,039,544
Purchase Details
Closed on
Dec 19, 1998
Sold by
Lichen Wei
Bought by
Bhasin Rakesh and Bhasin Anita
Home Financials for this Owner
Home Financials are based on the most recent Mortgage that was taken out on this home.
Original Mortgage
$220,800
Interest Rate
6.73%
Purchase Details
Closed on
Jun 22, 1994
Sold by
Wei Hsu Yung Fun
Bought by
Wei Li Chen
Create a Home Valuation Report for This Property
The Home Valuation Report is an in-depth analysis detailing your home's value as well as a comparison with similar homes in the area
Home Values in the Area
Average Home Value in this Area
Purchase History
| Date | Buyer | Sale Price | Title Company |
|---|---|---|---|
| Bhasin Rakesh | -- | None Available | |
| Vintage Petroleum Inc | -- | None Available | |
| Bhasin Rakesh | -- | None Available | |
| Bhasin Rakesh | $276,000 | Commonwealth Land Title | |
| Wei Li Chen | -- | -- |
Source: Public Records
Mortgage History
| Date | Status | Borrower | Loan Amount |
|---|---|---|---|
| Open | Bhasin Rakesh | $200,000 | |
| Closed | Bhasin Rakesh | $220,800 |
Source: Public Records
Tax History Compared to Growth
Tax History
| Year | Tax Paid | Tax Assessment Tax Assessment Total Assessment is a certain percentage of the fair market value that is determined by local assessors to be the total taxable value of land and additions on the property. | Land | Improvement |
|---|---|---|---|---|
| 2025 | $5,010 | $432,680 | $188,556 | $244,124 |
| 2024 | $5,010 | $424,197 | $184,859 | $239,338 |
| 2023 | $4,885 | $415,880 | $181,234 | $234,646 |
| 2022 | $4,822 | $407,726 | $177,680 | $230,046 |
| 2021 | $4,752 | $399,732 | $174,196 | $225,536 |
| 2020 | $4,724 | $395,634 | $172,410 | $223,224 |
| 2019 | $4,605 | $387,877 | $169,029 | $218,848 |
| 2018 | $4,521 | $380,272 | $165,715 | $214,557 |
| 2017 | $4,379 | $372,816 | $162,466 | $210,350 |
| 2016 | $4,295 | $365,506 | $159,280 | $206,226 |
| 2015 | $4,246 | $360,016 | $156,887 | $203,129 |
| 2014 | $4,033 | $352,964 | $153,814 | $199,150 |
Source: Public Records
Map
Nearby Homes
- 8452 Stanton Ave
- 2955 W Lincoln Ave Unit 7
- 2871 W Tyler Ave
- 7950 Jackson Way
- 2943 W Lincoln Ave
- 3053 W Coolidge Ave
- 8319 Hickory Dr
- Plan Two at Mason
- Plan Four at Mason
- Plan Three at Mason
- Plan Seven at Mason
- 109 S Laxore St
- 400 N Syracuse St
- 7720 Crescent Ave
- 103 S Laxore St
- 106 S Laxore St Unit 407
- 107 S Laxore St
- 2770 W Lincoln Ave Unit 40
- 2770 W Lincoln Ave Unit 58
- 605 N La Reina St
- 8207 Joshua Cir
- 8219 Joshua Cir
- 8201 Joshua Cir
- 8225 Joshua Cir
- 8212 Mahogany Cir
- 8218 Mahogany Cir
- 8206 Mahogany Cir
- 8200 Mahogany Cir
- 8195 Joshua Cir
- 8224 Mahogany Cir
- 8212 Joshua Cir
- 8206 Joshua Cir
- 8218 Joshua Cir
- 8194 Mahogany Cir
- 8200 Joshua Cir
- 8591 Bel Air St
- 8189 Joshua Cir
- 8581 Bel Air St
- 8194 Joshua Cir