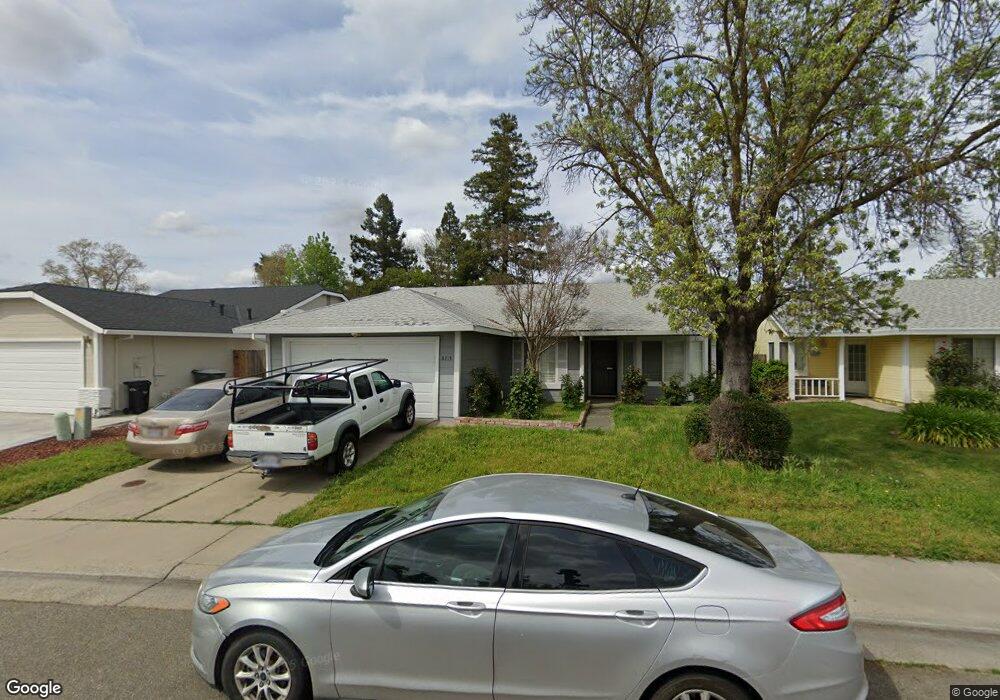
8213 Visalia Way Sacramento, CA 95828
Estimated Value: $425,478 - $491,000
3
Beds
2
Baths
1,165
Sq Ft
$390/Sq Ft
Est. Value
About This Home
This home is located at 8213 Visalia Way, Sacramento, CA 95828 and is currently estimated at $454,370, approximately $390 per square foot. 8213 Visalia Way is a home located in Sacramento County with nearby schools including Isabelle Jackson Elementary School, James Rutter Middle School, and Florin High School.
Ownership History
Date
Name
Owned For
Owner Type
Purchase Details
Closed on
Jan 31, 2011
Sold by
Household Finance Corporation Of Califor
Bought by
Lopez Manuel and Rodriguez Primitivo Lopez
Current Estimated Value
Home Financials for this Owner
Home Financials are based on the most recent Mortgage that was taken out on this home.
Original Mortgage
$126,606
Interest Rate
4.75%
Mortgage Type
FHA
Purchase Details
Closed on
Nov 30, 2010
Sold by
Bell Timothy S
Bought by
Household Finance Corporation Of Califor
Purchase Details
Closed on
Nov 21, 2000
Sold by
Jennett Bruce D and Jennett Loretta A
Bought by
Bell Timothy S
Home Financials for this Owner
Home Financials are based on the most recent Mortgage that was taken out on this home.
Original Mortgage
$103,150
Interest Rate
9.62%
Create a Home Valuation Report for This Property
The Home Valuation Report is an in-depth analysis detailing your home's value as well as a comparison with similar homes in the area
Home Values in the Area
Average Home Value in this Area
Purchase History
| Date | Buyer | Sale Price | Title Company |
|---|---|---|---|
| Lopez Manuel | $130,000 | Fidelity National Title Co | |
| Household Finance Corporation Of Califor | $318,234 | None Available | |
| Bell Timothy S | $129,000 | Alliance Title Company |
Source: Public Records
Mortgage History
| Date | Status | Borrower | Loan Amount |
|---|---|---|---|
| Previous Owner | Lopez Manuel | $126,606 | |
| Previous Owner | Bell Timothy S | $103,150 | |
| Closed | Bell Timothy S | $25,850 |
Source: Public Records
Tax History Compared to Growth
Tax History
| Year | Tax Paid | Tax Assessment Tax Assessment Total Assessment is a certain percentage of the fair market value that is determined by local assessors to be the total taxable value of land and additions on the property. | Land | Improvement |
|---|---|---|---|---|
| 2025 | $1,915 | $166,538 | $44,833 | $121,705 |
| 2024 | $1,915 | $163,273 | $43,954 | $119,319 |
| 2023 | $1,870 | $160,073 | $43,093 | $116,980 |
| 2022 | $1,840 | $156,936 | $42,249 | $114,687 |
| 2021 | $1,821 | $153,860 | $41,421 | $112,439 |
| 2020 | $1,798 | $152,284 | $40,997 | $111,287 |
| 2019 | $1,767 | $149,299 | $40,194 | $109,105 |
| 2018 | $1,723 | $146,372 | $39,406 | $106,966 |
| 2017 | $1,695 | $143,503 | $38,634 | $104,869 |
| 2016 | $1,617 | $140,690 | $37,877 | $102,813 |
| 2015 | $1,589 | $138,578 | $37,309 | $101,269 |
| 2014 | $1,565 | $135,865 | $36,579 | $99,286 |
Source: Public Records
Map
Nearby Homes
- 8186 Gustine Way
- 8251 Apple Cove Ct
- 8077 Goran Ct
- 8336 Cutler Way
- 7905 Springarden Way
- 8317 Honeycomb Way
- 8346 Floxtree Ct
- 7901 Stevenson Ave
- 8012 Northern Oak Cir
- 8437 Yermo Way
- 8095 E Stockton Blvd
- 8266 Summer Sunset Dr
- 4.13 ACR Lenhart Rd
- 8282 Union Creek Way
- 8336 Summer Sunset Dr
- 7715 Cotton Ln
- 7711 Lenhart Rd
- 8233 Short Rd
- 8205 Weyburn Ct
- 0 Rangeview Ln
- 8217 Visalia Way
- 8207 Visalia Way
- 8210 Scenic Hills Way
- 8221 Visalia Way
- 8206 Scenic Hills Way
- 8214 Scenic Hills Way
- 8212 Visalia Way
- 8143 Pixley Way
- 8139 Pixley Way
- 8218 Scenic Hills Way
- 8225 Visalia Way
- 8218 Visalia Way
- 8149 Pixley Way
- 8160 Spanish Wells Ct
- 8222 Visalia Way
- 8222 Scenic Hills Way
- 8229 Visalia Way
- 8165 Spanish Wells Ct
- 8226 Visalia Way
- 8164 Spanish Wells Ct