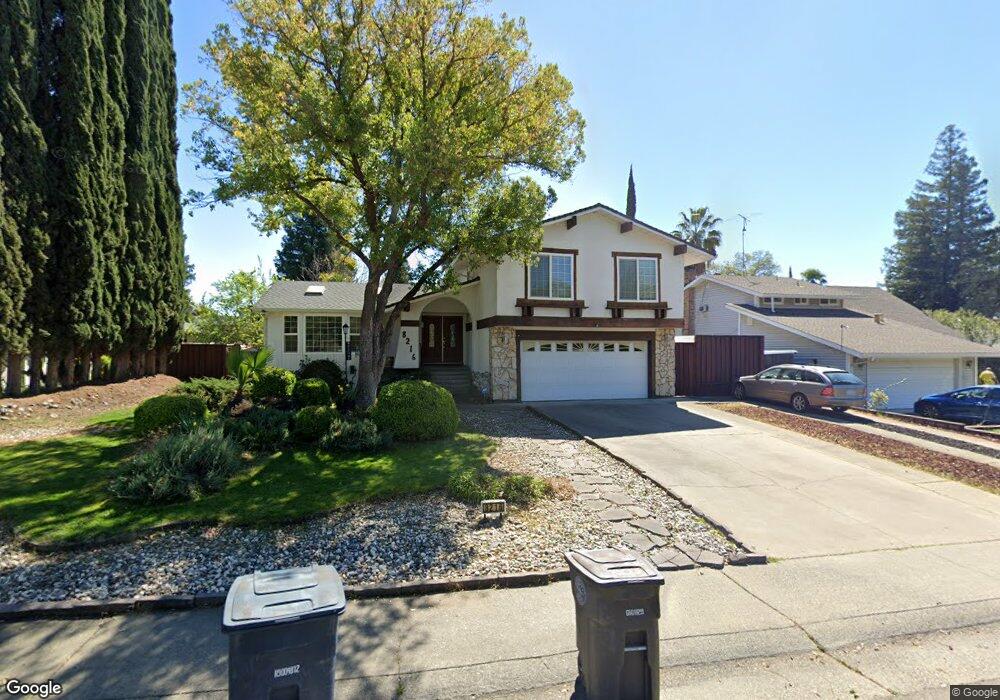
8216 Moss Oak Ave Citrus Heights, CA 95610
Estimated Value: $435,000 - $639,000
4
Beds
3
Baths
2,334
Sq Ft
$247/Sq Ft
Est. Value
About This Home
This home is located at 8216 Moss Oak Ave, Citrus Heights, CA 95610 and is currently estimated at $576,665, approximately $247 per square foot. 8216 Moss Oak Ave is a home located in Sacramento County with nearby schools including Woodside K-8, San Juan High School, and Country Hill Montessori School.
Ownership History
Date
Name
Owned For
Owner Type
Purchase Details
Closed on
May 2, 2001
Sold by
Jenkins John E and Jenkins Gretchen R
Bought by
Batayeh David D and Batayeh Trina N
Current Estimated Value
Home Financials for this Owner
Home Financials are based on the most recent Mortgage that was taken out on this home.
Original Mortgage
$243,200
Interest Rate
6.92%
Purchase Details
Closed on
Sep 26, 2000
Sold by
Campbell John J and Campbell Pauline L
Bought by
Jenkins John E and Jenkins Gretchen R
Home Financials for this Owner
Home Financials are based on the most recent Mortgage that was taken out on this home.
Original Mortgage
$175,200
Interest Rate
7.98%
Create a Home Valuation Report for This Property
The Home Valuation Report is an in-depth analysis detailing your home's value as well as a comparison with similar homes in the area
Home Values in the Area
Average Home Value in this Area
Purchase History
| Date | Buyer | Sale Price | Title Company |
|---|---|---|---|
| Batayeh David D | $256,000 | Financial Title Company | |
| Jenkins John E | $219,000 | Financial Title Company |
Source: Public Records
Mortgage History
| Date | Status | Borrower | Loan Amount |
|---|---|---|---|
| Previous Owner | Batayeh David D | $243,200 | |
| Previous Owner | Jenkins John E | $175,200 |
Source: Public Records
Tax History Compared to Growth
Tax History
| Year | Tax Paid | Tax Assessment Tax Assessment Total Assessment is a certain percentage of the fair market value that is determined by local assessors to be the total taxable value of land and additions on the property. | Land | Improvement |
|---|---|---|---|---|
| 2025 | $4,481 | $385,729 | $75,330 | $310,399 |
| 2024 | $4,481 | $378,166 | $73,853 | $304,313 |
| 2023 | $4,366 | $370,752 | $72,405 | $298,347 |
| 2022 | $4,341 | $363,484 | $70,986 | $292,498 |
| 2021 | $4,268 | $356,358 | $69,595 | $286,763 |
| 2020 | $4,188 | $352,705 | $68,882 | $283,823 |
| 2019 | $4,102 | $345,790 | $67,532 | $278,258 |
| 2018 | $4,053 | $339,010 | $66,208 | $272,802 |
| 2017 | $4,012 | $332,363 | $64,910 | $267,453 |
| 2016 | $3,747 | $325,847 | $63,638 | $262,209 |
| 2015 | $3,682 | $320,954 | $62,683 | $258,271 |
| 2014 | $3,604 | $314,668 | $61,456 | $253,212 |
Source: Public Records
Map
Nearby Homes
- 1527 Crestmont Ave
- 8058 Mesa Oak Way
- 1513 Crestmont Oak Dr
- 8232 Garry Oak Dr
- 8206 Peregrine Way
- 1501 Crestmont Ave
- 8204 Conover Dr
- 1529 Pine Valley Cir
- 0 Charlotte Ave
- 1421 Champion Oaks Dr
- 8000 Aspen Ln
- 7861 Claypool Way
- 8358 Cedarwood Ln Unit 72
- 1817 Woodacre Way
- 1812 Wildwood Way
- 1816 Wildwood Way
- 1902 Wildwood Way
- 8317 Keyesport Way
- 7732 Smoley Way
- 167 Rimma Way
- 8220 Moss Oak Ave
- 8212 Moss Oak Ave
- 8221 Coast Oak Way
- 8208 Moss Oak Ave
- 8225 Coast Oak Way
- 8224 Moss Oak Ave
- 8217 Coast Oak Way
- 8229 Coast Oak Way
- 8213 Coast Oak Way
- 8228 Moss Oak Ave
- 8204 Moss Oak Ave
- 8201 Moss Oak Ave
- 8233 Coast Oak Way
- 8227 Moss Oak Ave
- 8209 Coast Oak Way
- 8232 Moss Oak Ave
- 8220 Coast Oak Way
- 8308 Crestmont Ave
- 8224 Coast Oak Way
- 8237 Coast Oak Way