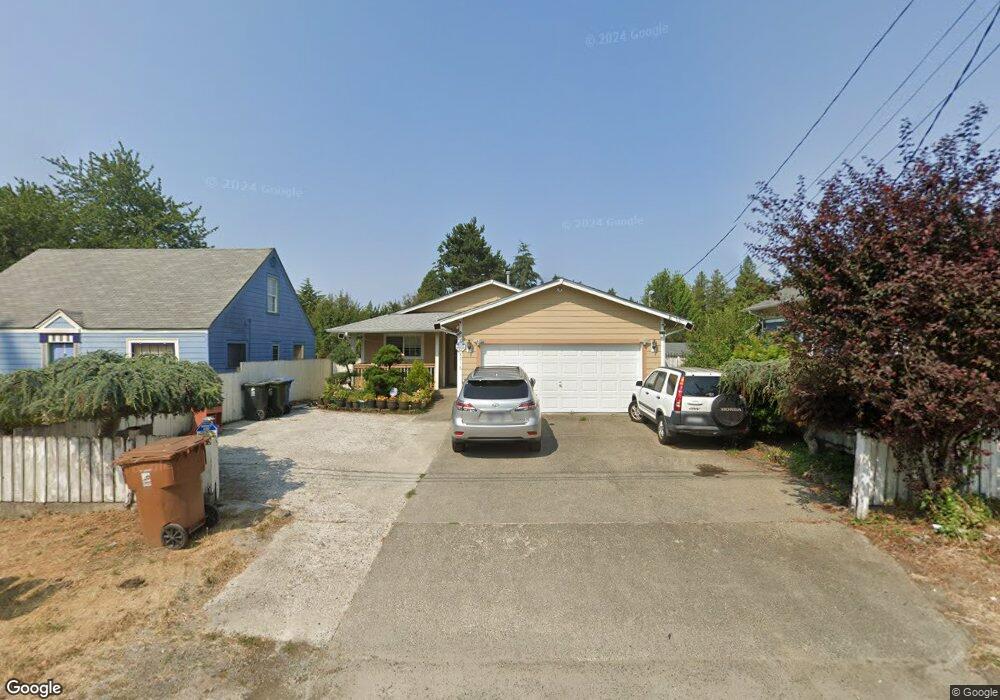
8216 S D St Tacoma, WA 98408
South End NeighborhoodEstimated Value: $449,000 - $491,000
3
Beds
2
Baths
1,269
Sq Ft
$368/Sq Ft
Est. Value
About This Home
This home is located at 8216 S D St, Tacoma, WA 98408 and is currently estimated at $467,006, approximately $368 per square foot. 8216 S D St is a home located in Pierce County with nearby schools including Fern Hill Elementary School, Baker Middle School, and Mount Tahoma High School.
Ownership History
Date
Name
Owned For
Owner Type
Purchase Details
Closed on
Jul 7, 2013
Sold by
Nguyen Phuong Huu and Tran Hong Diep T
Bought by
Nguyen Phuong Huu and Tran Hong Diep T
Current Estimated Value
Purchase Details
Closed on
Jun 14, 2010
Sold by
Nguyen Phuong Huu and Tran Hong Diep T
Bought by
Nguyen Phuong Huu and Tran Hong Diep T
Purchase Details
Closed on
Apr 19, 1999
Sold by
Remy Claude A
Bought by
Nguyen Phuong Huu and Tran Hong Diep T
Home Financials for this Owner
Home Financials are based on the most recent Mortgage that was taken out on this home.
Original Mortgage
$107,120
Outstanding Balance
$27,260
Interest Rate
7.1%
Estimated Equity
$439,746
Create a Home Valuation Report for This Property
The Home Valuation Report is an in-depth analysis detailing your home's value as well as a comparison with similar homes in the area
Home Values in the Area
Average Home Value in this Area
Purchase History
| Date | Buyer | Sale Price | Title Company |
|---|---|---|---|
| Nguyen Phuong Huu | -- | None Available | |
| Nguyen Phuong Huu | $76,047 | Talon Group | |
| Nguyen Phuong Huu | $117,500 | -- |
Source: Public Records
Mortgage History
| Date | Status | Borrower | Loan Amount |
|---|---|---|---|
| Open | Nguyen Phuong Huu | $107,120 |
Source: Public Records
Tax History Compared to Growth
Tax History
| Year | Tax Paid | Tax Assessment Tax Assessment Total Assessment is a certain percentage of the fair market value that is determined by local assessors to be the total taxable value of land and additions on the property. | Land | Improvement |
|---|---|---|---|---|
| 2025 | $4,535 | $465,100 | $195,100 | $270,000 |
| 2024 | $4,535 | $435,200 | $188,000 | $247,200 |
| 2023 | $4,535 | $407,200 | $179,000 | $228,200 |
| 2022 | $4,311 | $443,000 | $168,400 | $274,600 |
| 2021 | $3,937 | $313,100 | $107,300 | $205,800 |
| 2019 | $3,344 | $285,400 | $88,600 | $196,800 |
| 2018 | $3,549 | $257,200 | $71,800 | $185,400 |
| 2017 | $3,181 | $224,600 | $57,800 | $166,800 |
| 2016 | $2,745 | $170,100 | $43,200 | $126,900 |
| 2014 | $2,377 | $157,800 | $40,800 | $117,000 |
| 2013 | $2,377 | $138,900 | $35,900 | $103,000 |
Source: Public Records
Map
Nearby Homes