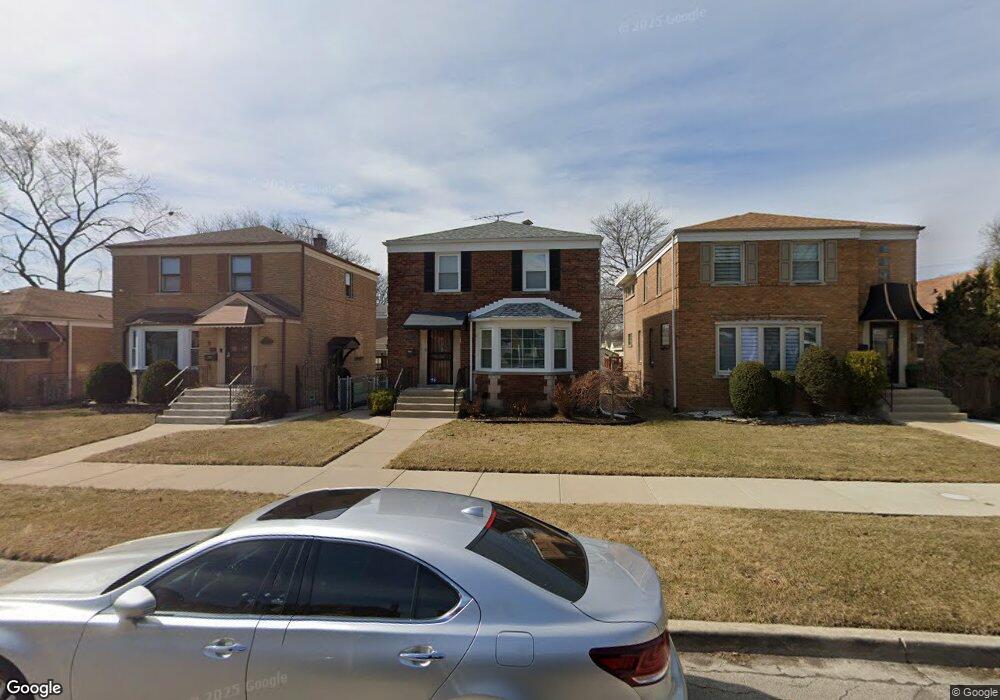
8216 S Homan Ave Chicago, IL 60652
Ashburn NeighborhoodEstimated Value: $246,000 - $307,000
3
Beds
1
Bath
1,218
Sq Ft
$233/Sq Ft
Est. Value
About This Home
This home is located at 8216 S Homan Ave, Chicago, IL 60652 and is currently estimated at $283,318, approximately $232 per square foot. 8216 S Homan Ave is a home located in Cook County with nearby schools including Carroll-Rosenwald Elementary School - Carroll Campus, Bogan Computer Technical High School, and CICS - Wrightwood.
Ownership History
Date
Name
Owned For
Owner Type
Purchase Details
Closed on
Feb 9, 2022
Sold by
Wallace Rhonda M and Hicks Rhonda M
Bought by
Wallace Rhonda M and Wallace Y
Current Estimated Value
Purchase Details
Closed on
Jan 17, 2022
Sold by
Wallace Rhonda M and Hicks Rhonda M
Bought by
Wallace Rhonda M and Wallace Y
Purchase Details
Closed on
Jul 29, 2009
Sold by
Braxton Evelyn M
Bought by
Hicks Rhonda
Home Financials for this Owner
Home Financials are based on the most recent Mortgage that was taken out on this home.
Original Mortgage
$162,993
Interest Rate
5.36%
Mortgage Type
FHA
Purchase Details
Closed on
Jun 27, 1995
Sold by
Puttkammer Clarence E
Bought by
Braxton Evelyn M
Home Financials for this Owner
Home Financials are based on the most recent Mortgage that was taken out on this home.
Original Mortgage
$99,900
Interest Rate
7.88%
Mortgage Type
Assumption
Create a Home Valuation Report for This Property
The Home Valuation Report is an in-depth analysis detailing your home's value as well as a comparison with similar homes in the area
Home Values in the Area
Average Home Value in this Area
Purchase History
| Date | Buyer | Sale Price | Title Company |
|---|---|---|---|
| Wallace Rhonda M | -- | -- | |
| Wallace Rhonda M | -- | -- | |
| Wallace Rhonda M | -- | -- | |
| Hicks Rhonda | $166,000 | Mutilple | |
| Braxton Evelyn M | $100,000 | -- |
Source: Public Records
Mortgage History
| Date | Status | Borrower | Loan Amount |
|---|---|---|---|
| Previous Owner | Hicks Rhonda | $162,993 | |
| Previous Owner | Braxton Evelyn M | $99,900 |
Source: Public Records
Tax History Compared to Growth
Tax History
| Year | Tax Paid | Tax Assessment Tax Assessment Total Assessment is a certain percentage of the fair market value that is determined by local assessors to be the total taxable value of land and additions on the property. | Land | Improvement |
|---|---|---|---|---|
| 2024 | $3,121 | $20,000 | $2,625 | $17,375 |
| 2023 | $3,022 | $18,000 | $3,500 | $14,500 |
| 2022 | $3,022 | $18,000 | $3,500 | $14,500 |
| 2021 | $2,973 | $18,000 | $3,500 | $14,500 |
| 2020 | $2,331 | $13,476 | $3,500 | $9,976 |
| 2019 | $2,339 | $14,974 | $3,500 | $11,474 |
| 2018 | $2,299 | $14,974 | $3,500 | $11,474 |
| 2017 | $2,034 | $12,739 | $3,062 | $9,677 |
| 2016 | $2,070 | $12,739 | $3,062 | $9,677 |
| 2015 | $1,871 | $12,739 | $3,062 | $9,677 |
| 2014 | $2,176 | $14,178 | $2,843 | $11,335 |
| 2013 | $2,122 | $14,178 | $2,843 | $11,335 |
Source: Public Records
Map
Nearby Homes
- 3433 W 82nd Place
- 8118 S Spaulding Ave
- 8223 S Sawyer Ave
- 3442 W 84th St
- 3237 W 83rd Place
- 3530 W 80th Place
- 3644 W 82nd St
- 3617 W 80th Place
- 8053 S Kedzie Ave
- 8033 S Kedzie Ave
- 3631 W 80th Place
- 3648 W 81st St
- 8230 S Albany Ave
- 8242 S Albany Ave
- 3720 W 82nd St
- 7826 S Christiana Ave
- 7809 S Christiana Ave
- 8232 S Sacramento Ave
- 8034 S Sacramento Ave
- 7756 S Spaulding Ave
- 8212 S Homan Ave
- 8220 S Homan Ave
- 8208 S Homan Ave
- 8224 S Homan Ave
- 3414 W 82nd Place
- 8206 S Homan Ave
- 3418 W 82nd Place
- 3415 W 82nd St
- 8200 S Homan Ave
- 3419 W 82nd St
- 3422 W 82nd Place
- 8215 S Homan Ave
- 8236 S Homan Ave
- 8219 S Homan Ave
- 8211 S Homan Ave
- 3423 W 82nd St
- 8223 S Homan Ave
- 3426 W 82nd Place
- 8227 S Homan Ave