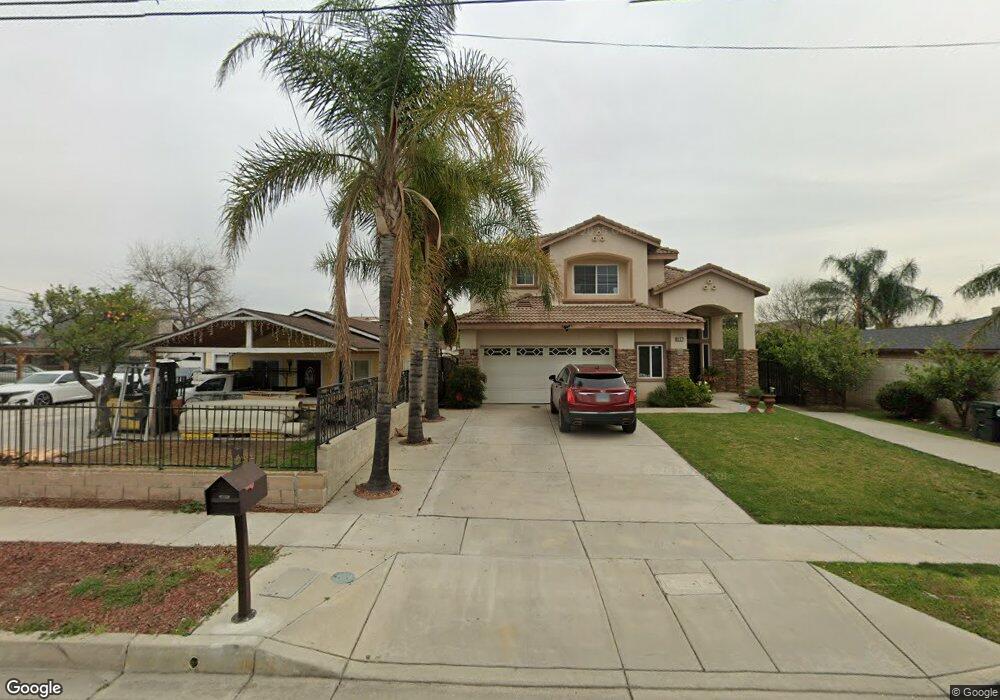
8217 Laurel Ave Fontana, CA 92335
Estimated Value: $296,000 - $436,000
1
Bed
1
Bath
880
Sq Ft
$424/Sq Ft
Est. Value
About This Home
This home is located at 8217 Laurel Ave, Fontana, CA 92335 and is currently estimated at $373,302, approximately $424 per square foot. 8217 Laurel Ave is a home located in San Bernardino County with nearby schools including Ted Porter Elementary School, Alder Middle School, and Fontana A. B. Miller High School.
Ownership History
Date
Name
Owned For
Owner Type
Purchase Details
Closed on
Mar 19, 2015
Sold by
Ortiz Gonzalo
Bought by
Preciado Munoz Rogelio Duran and Preciado Munoz Ramona
Current Estimated Value
Purchase Details
Closed on
Jan 19, 1996
Sold by
Federal Home Loan Mortgage Corporation
Bought by
Ortiz Gonzalo
Home Financials for this Owner
Home Financials are based on the most recent Mortgage that was taken out on this home.
Original Mortgage
$44,650
Interest Rate
7.14%
Purchase Details
Closed on
Jul 25, 1995
Sold by
Federal National Mortgage Association
Bought by
Federal Home Loan Mtg Assn
Purchase Details
Closed on
Mar 28, 1995
Sold by
Rogers Gloria
Bought by
Federal Home Loan Mortgage Corporation
Purchase Details
Closed on
Mar 15, 1995
Sold by
Rogers Gloria
Bought by
Federal National Mortgage Association
Create a Home Valuation Report for This Property
The Home Valuation Report is an in-depth analysis detailing your home's value as well as a comparison with similar homes in the area
Purchase History
| Date | Buyer | Sale Price | Title Company |
|---|---|---|---|
| Preciado Munoz Rogelio Duran | $105,000 | Pacific Coast Title | |
| Ortiz Gonzalo | $47,000 | Continental Lawyers Title Co | |
| Federal Home Loan Mtg Assn | -- | Continental Lawyers Title Co | |
| Federal Home Loan Mortgage Corporation | $63,000 | Northern Counties Title Ins | |
| Federal National Mortgage Association | $63,000 | Northern Counties Title Ins |
Source: Public Records
Mortgage History
| Date | Status | Borrower | Loan Amount |
|---|---|---|---|
| Previous Owner | Ortiz Gonzalo | $44,650 |
Source: Public Records
Tax History
| Year | Tax Paid | Tax Assessment Tax Assessment Total Assessment is a certain percentage of the fair market value that is determined by local assessors to be the total taxable value of land and additions on the property. | Land | Improvement |
|---|---|---|---|---|
| 2025 | $2,159 | $149,868 | $48,073 | $101,795 |
| 2024 | $2,026 | $146,929 | $47,130 | $99,799 |
| 2023 | $2,014 | $144,048 | $46,206 | $97,842 |
| 2022 | $1,854 | $141,224 | $45,300 | $95,924 |
| 2021 | $1,816 | $138,455 | $44,412 | $94,043 |
| 2020 | $1,795 | $137,036 | $43,957 | $93,079 |
| 2019 | $2,047 | $134,349 | $43,095 | $91,254 |
| 2018 | $1,395 | $131,715 | $42,250 | $89,465 |
| 2017 | $1,759 | $155,334 | $56,956 | $98,378 |
| 2016 | $1,729 | $152,288 | $55,839 | $96,449 |
| 2015 | $1,105 | $103,668 | $34,554 | $69,114 |
| 2014 | -- | $101,637 | $33,877 | $67,760 |
Source: Public Records
Map
Nearby Homes
- 17824 Ivy Ave
- 17844 Owen St
- 17640 Foothill Blvd
- 18206 Seville Ave
- 18013 Arrow Blvd
- 250 N Linden Ave Unit 124
- 250 N Linden Ave Unit Spc 148
- 250 N Linden Ave Unit 327
- 250 N Linden Ave Unit 250
- 250 N Linden Ave
- 17562 Court St
- 17923 Dorsey Way
- 7740 Lombardy Ave
- 1669 W Victoria St
- 1560 W Ramona Dr
- 17416 Malaga St
- 8787 Locust Ave Unit 82
- 8787 Locust Ave Unit 1
- 8787 Locust Ave Unit 68
- 8787 Locust Ave Unit 28
- 8227 Laurel Ave
- 8207 Laurel Ave
- 8235 Laurel Ave
- 17936 Ivy Ave
- 8195 Laurel Ave
- 8245 Laurel Ave
- 17892 Ivy Ave
- 17935 Ivy Ave
- 8185 Laurel Ave
- 17944 Ivy Ave
- 17891 Ivy Ave
- 8253 Laurel Ave
- 17890 Ivy Ave
- 8198 Laurel Ave
- 17943 Ivy Ave
- 17952 Ivy Ave
- 17928 Upland Ave
- 17885 Vine St
- 17951 Ivy Ave
- 17936 Upland Ave