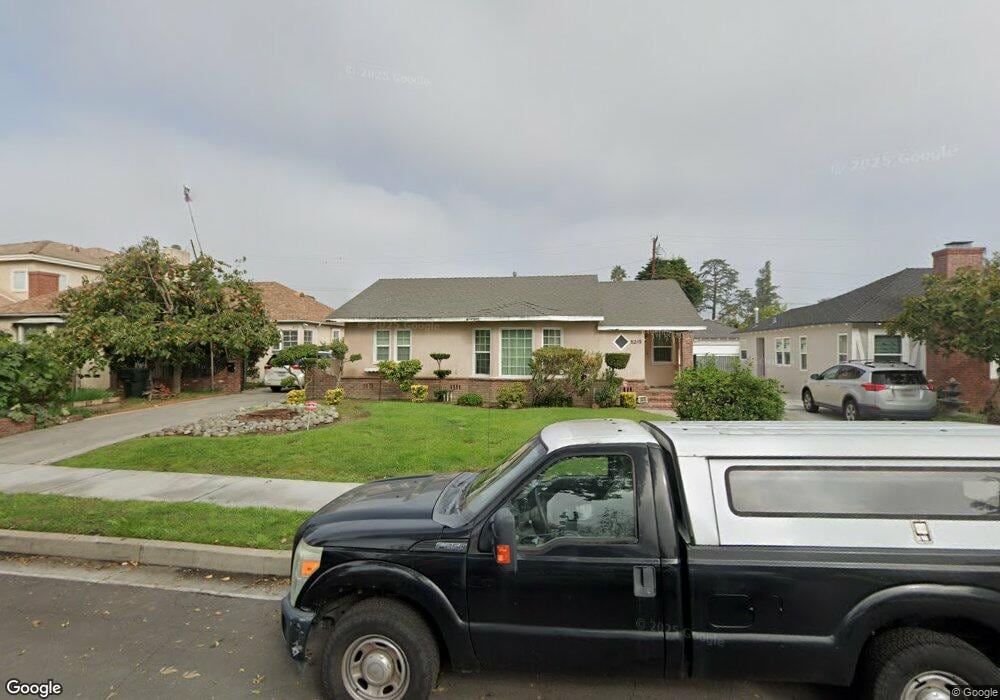
8219 Santa Ynez St San Gabriel, CA 91775
Estimated Value: $1,382,605 - $1,507,000
3
Beds
2
Baths
1,798
Sq Ft
$803/Sq Ft
Est. Value
About This Home
This home is located at 8219 Santa Ynez St, San Gabriel, CA 91775 and is currently estimated at $1,444,401, approximately $803 per square foot. 8219 Santa Ynez St is a home located in Los Angeles County with nearby schools including Wilson Elementary School, Jefferson Middle School, and Gabrielino High School.
Ownership History
Date
Name
Owned For
Owner Type
Purchase Details
Closed on
Dec 11, 2012
Sold by
Ho Alex and Ho Ivy Yang
Bought by
Chao Raymond Yen and Chao Amy Tay
Current Estimated Value
Home Financials for this Owner
Home Financials are based on the most recent Mortgage that was taken out on this home.
Original Mortgage
$410,000
Outstanding Balance
$304,863
Interest Rate
5%
Mortgage Type
Adjustable Rate Mortgage/ARM
Estimated Equity
$1,139,538
Purchase Details
Closed on
Mar 1, 2010
Sold by
Chang Leo S and Yang Yen Ping
Bought by
Ho Alex and Ho Ivy Yang
Home Financials for this Owner
Home Financials are based on the most recent Mortgage that was taken out on this home.
Original Mortgage
$500,000
Interest Rate
4.94%
Mortgage Type
New Conventional
Purchase Details
Closed on
Oct 27, 2009
Sold by
Liu Vincent Cheng Teh and Caducio Carina
Bought by
Yang Yen Ping
Create a Home Valuation Report for This Property
The Home Valuation Report is an in-depth analysis detailing your home's value as well as a comparison with similar homes in the area
Home Values in the Area
Average Home Value in this Area
Purchase History
| Date | Buyer | Sale Price | Title Company |
|---|---|---|---|
| Chao Raymond Yen | $690,000 | Lawyers Title | |
| Ho Alex | $685,000 | Fidelity National Title Co | |
| Yang Yen Ping | -- | Fidelity National Title Co |
Source: Public Records
Mortgage History
| Date | Status | Borrower | Loan Amount |
|---|---|---|---|
| Open | Chao Raymond Yen | $410,000 | |
| Previous Owner | Ho Alex | $500,000 |
Source: Public Records
Tax History Compared to Growth
Tax History
| Year | Tax Paid | Tax Assessment Tax Assessment Total Assessment is a certain percentage of the fair market value that is determined by local assessors to be the total taxable value of land and additions on the property. | Land | Improvement |
|---|---|---|---|---|
| 2025 | $10,223 | $849,673 | $511,652 | $338,021 |
| 2024 | $10,223 | $833,014 | $501,620 | $331,394 |
| 2023 | $10,043 | $816,682 | $491,785 | $324,897 |
| 2022 | $9,596 | $800,670 | $482,143 | $318,527 |
| 2021 | $9,538 | $784,972 | $472,690 | $312,282 |
| 2019 | $9,100 | $761,691 | $458,671 | $303,020 |
| 2018 | $9,029 | $746,757 | $449,678 | $297,079 |
| 2016 | $8,581 | $717,761 | $432,217 | $285,544 |
| 2015 | $8,461 | $706,980 | $425,725 | $281,255 |
| 2014 | -- | $693,132 | $417,386 | $275,746 |
Source: Public Records
Map
Nearby Homes
- 8215 Beverly Dr
- 118 N Gladys Ave Unit F
- 5716 N Charlotte Ave
- 101 N San Gabriel Blvd
- 6013 N Walnut Grove Ave
- 5633 N Charlotte Ave
- 5613 N Charlotte Ave
- 420 E Las Tunas Dr Unit 3C
- 143 Country Club Dr
- 428 N Del Mar Ave
- 401 E Live Oak St
- 229 Cresta Ave
- 1120 E Las Tunas Dr Unit 2
- 8216 Sheffield Rd
- 137 Saint Francis St Unit A
- 521 N Del Mar Ave
- 1230 Elm Ave Unit G
- 5517 N Del Loma Ave
- 501 Gerona Ave
- 1290 Elm Ave Unit D
- 8225 Santa Ynez St
- 8215 Santa Ynez St
- 8231 Santa Ynez St
- 8209 Santa Ynez St
- 8220 Bevan St
- 8224 Bevan St
- 8214 Bevan St
- 8237 Santa Ynez St
- 8203 Santa Ynez St
- 8230 Bevan St
- 818 Santa Ynez St
- 812 Santa Ynez St
- 824 Santa Ynez St
- 8236 Bevan St
- 8200 Bevan St
- 806 Santa Ynez St
- 8241 Santa Ynez St
- 830 Santa Ynez St
- 800 Santa Ynez St
- 8240 Bevan St