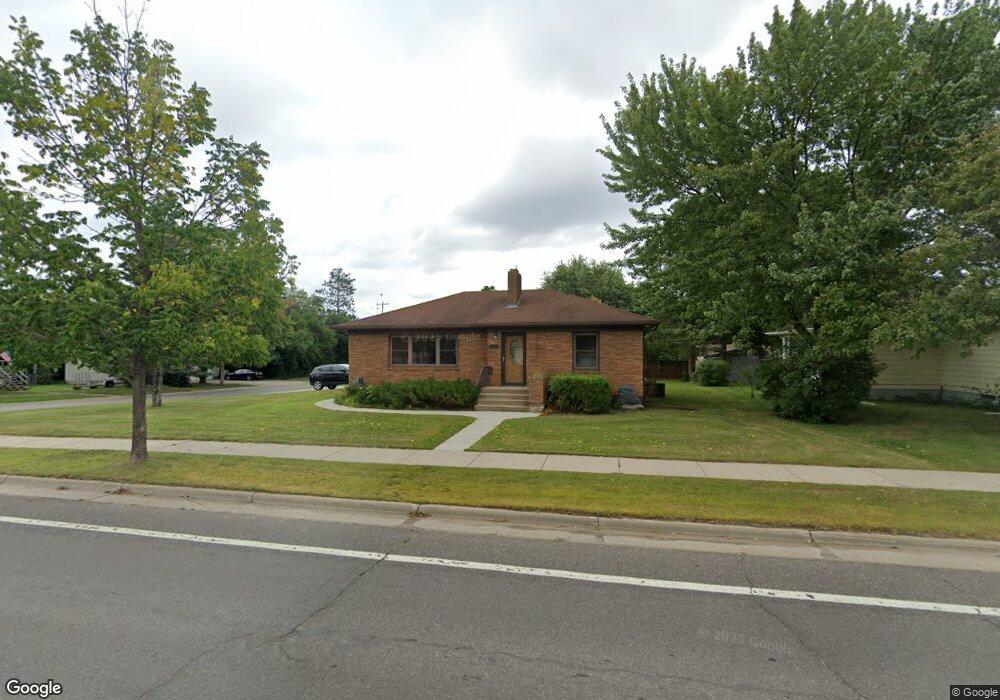
822 3rd Ave NW Chisholm, MN 55719
Estimated Value: $190,000 - $218,000
4
Beds
2
Baths
1,413
Sq Ft
$144/Sq Ft
Est. Value
About This Home
This home is located at 822 3rd Ave NW, Chisholm, MN 55719 and is currently estimated at $203,854, approximately $144 per square foot. 822 3rd Ave NW is a home located in St. Louis County with nearby schools including Vaughan Elementary School, Chisholm Elementary School, and Chisholm Secondary School.
Ownership History
Date
Name
Owned For
Owner Type
Purchase Details
Closed on
Dec 13, 2002
Sold by
Minerich James A and Minerich Sarah
Bought by
Northern Habilitative Services Of Chisho
Current Estimated Value
Purchase Details
Closed on
Mar 27, 2002
Sold by
Minerich Virginia M
Bought by
Minerich James A and Matack Linda M
Create a Home Valuation Report for This Property
The Home Valuation Report is an in-depth analysis detailing your home's value as well as a comparison with similar homes in the area
Home Values in the Area
Average Home Value in this Area
Purchase History
| Date | Buyer | Sale Price | Title Company |
|---|---|---|---|
| Northern Habilitative Services Of Chisho | $86,000 | -- | |
| Minerich James A | -- | -- |
Source: Public Records
Tax History Compared to Growth
Tax History
| Year | Tax Paid | Tax Assessment Tax Assessment Total Assessment is a certain percentage of the fair market value that is determined by local assessors to be the total taxable value of land and additions on the property. | Land | Improvement |
|---|---|---|---|---|
| 2024 | $2,896 | $149,700 | $8,000 | $141,700 |
| 2023 | $2,896 | $193,500 | $10,300 | $183,200 |
| 2022 | $1,764 | $120,900 | $6,800 | $114,100 |
| 2021 | $1,748 | $99,500 | $4,000 | $95,500 |
| 2020 | $1,596 | $93,700 | $4,000 | $89,700 |
| 2019 | $1,628 | $90,000 | $4,000 | $86,000 |
| 2018 | $1,532 | $90,000 | $4,000 | $86,000 |
| 2017 | $1,422 | $90,000 | $4,000 | $86,000 |
| 2016 | $1,424 | $84,500 | $7,200 | $77,300 |
| 2015 | $1,646 | $80,600 | $7,200 | $73,400 |
| 2014 | $1,646 | $83,300 | $7,200 | $76,100 |
Source: Public Records
Map
Nearby Homes