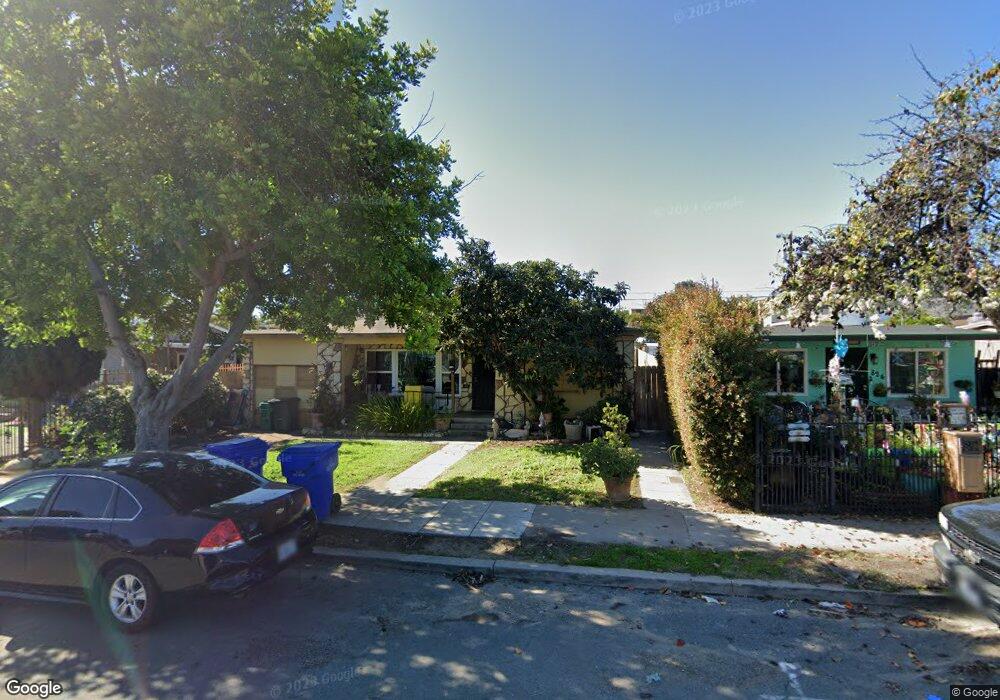
822 41st St San Diego, CA 92102
Mount Hope NeighborhoodEstimated Value: $764,000 - $859,000
--
Bed
--
Bath
--
Sq Ft
6,098
Sq Ft Lot
About This Home
This home is located at 822 41st St, San Diego, CA 92102 and is currently estimated at $805,333. 822 41st St is a home located in San Diego County with nearby schools including Chollas/Mead Elementary School, Millennial Tech Middle School, and Lincoln High School.
Ownership History
Date
Name
Owned For
Owner Type
Purchase Details
Closed on
Jul 16, 2014
Sold by
Williams Alex and Williams Jackie M
Bought by
Alex & Jackie Williams Family Trust
Current Estimated Value
Home Financials for this Owner
Home Financials are based on the most recent Mortgage that was taken out on this home.
Original Mortgage
$99,000
Interest Rate
4.13%
Mortgage Type
Commercial
Purchase Details
Closed on
Jun 26, 2009
Sold by
Williams Alex and Williams Jackie M
Bought by
Williams Alex and Williams Jackie M
Home Financials for this Owner
Home Financials are based on the most recent Mortgage that was taken out on this home.
Original Mortgage
$104,000
Interest Rate
5.59%
Mortgage Type
Commercial
Purchase Details
Closed on
May 9, 2007
Sold by
Williams Alex and Williams Jackie Marie
Bought by
Williams Alex and Williams Jackie M
Create a Home Valuation Report for This Property
The Home Valuation Report is an in-depth analysis detailing your home's value as well as a comparison with similar homes in the area
Home Values in the Area
Average Home Value in this Area
Purchase History
| Date | Buyer | Sale Price | Title Company |
|---|---|---|---|
| Alex & Jackie Williams Family Trust | -- | Accommodation | |
| Williams Alex | -- | Lawyers Title | |
| Williams Alex | -- | Chicago Title Company | |
| Williams Alex | -- | Chicago Title Company | |
| Williams Alex | -- | None Available |
Source: Public Records
Mortgage History
| Date | Status | Borrower | Loan Amount |
|---|---|---|---|
| Closed | Williams Alex | $99,000 | |
| Closed | Williams Alex | $104,000 |
Source: Public Records
Tax History Compared to Growth
Tax History
| Year | Tax Paid | Tax Assessment Tax Assessment Total Assessment is a certain percentage of the fair market value that is determined by local assessors to be the total taxable value of land and additions on the property. | Land | Improvement |
|---|---|---|---|---|
| 2025 | $522 | $40,362 | $9,670 | $30,692 |
| 2024 | $522 | $39,572 | $9,481 | $30,091 |
| 2023 | $509 | $38,797 | $9,296 | $29,501 |
| 2022 | $496 | $38,037 | $9,114 | $28,923 |
| 2021 | $493 | $37,292 | $8,936 | $28,356 |
| 2020 | $487 | $36,911 | $8,845 | $28,066 |
| 2019 | $479 | $36,188 | $8,672 | $27,516 |
| 2018 | $450 | $35,479 | $8,502 | $26,977 |
| 2017 | $439 | $34,785 | $8,336 | $26,449 |
| 2016 | $430 | $34,104 | $8,173 | $25,931 |
| 2015 | $424 | $33,593 | $8,051 | $25,542 |
| 2014 | $419 | $32,936 | $7,894 | $25,042 |
Source: Public Records
Map
Nearby Homes
- 1020 41st St
- 530 42nd St Unit 1 & 2
- 514 42nd St
- 4264 Market St
- 441-43 Morrison St
- 4225 J St
- 821
- 3688 Cactusview Dr
- 3665 Ash St Unit 7
- 1720 Midvale Dr
- 1505 Bridgeview Dr
- 0 36th St Unit 4 240028878
- 0 36th St Unit 3 240028877
- 1480 Bridgeview Dr
- 740 Cotton St
- 3891 Superba St
- 3171 3175 K St
- 441 443 N 41st St
- 348 & 350 27th St
- 282 Pardee St