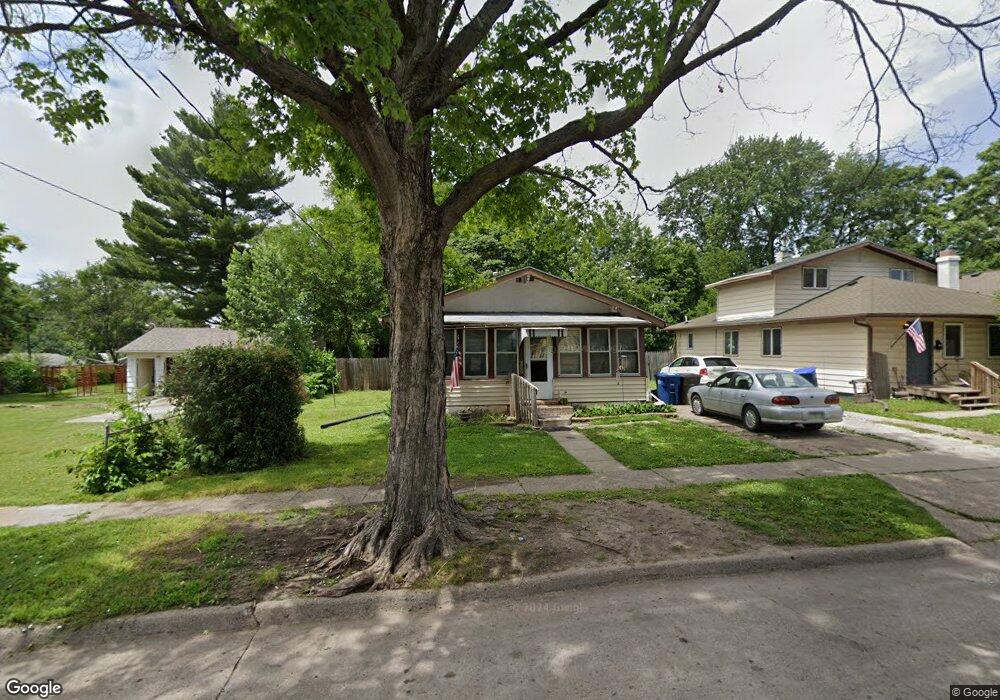
822 E 26th Ct Des Moines, IA 50317
Fairground NeighborhoodEstimated Value: $123,000 - $157,000
2
Beds
1
Bath
936
Sq Ft
$151/Sq Ft
Est. Value
About This Home
This home is located at 822 E 26th Ct, Des Moines, IA 50317 and is currently estimated at $141,249, approximately $150 per square foot. 822 E 26th Ct is a home located in Polk County with nearby schools including Capitol View Elementary School, Hiatt Middle School, and East High School.
Ownership History
Date
Name
Owned For
Owner Type
Purchase Details
Closed on
Aug 31, 2011
Sold by
Sonderleiter Bud J and Sonderleiter Leola M
Bought by
Sonderleiter Michael and Sonderleiter Mary K
Current Estimated Value
Purchase Details
Closed on
Jan 27, 2010
Sold by
Sonderleiter Michael B and Sonderleiter Mary Kay
Bought by
Sonderleiter Bud J and Sonderleiter Leola M
Purchase Details
Closed on
Apr 3, 2009
Sold by
Sonderleiter Bud J and Sonderleiter Leola M
Bought by
Sonderleiter Michael B and Sonderleiter Mary Kay
Create a Home Valuation Report for This Property
The Home Valuation Report is an in-depth analysis detailing your home's value as well as a comparison with similar homes in the area
Home Values in the Area
Average Home Value in this Area
Purchase History
| Date | Buyer | Sale Price | Title Company |
|---|---|---|---|
| Sonderleiter Michael | -- | None Available | |
| Sonderleiter Bud J | -- | None Available | |
| Sonderleiter Michael B | -- | None Available |
Source: Public Records
Tax History
| Year | Tax Paid | Tax Assessment Tax Assessment Total Assessment is a certain percentage of the fair market value that is determined by local assessors to be the total taxable value of land and additions on the property. | Land | Improvement |
|---|---|---|---|---|
| 2025 | $1,004 | $119,000 | $27,900 | $91,100 |
| 2024 | $1,004 | $101,900 | $23,700 | $78,200 |
| 2023 | $1,664 | $101,900 | $23,700 | $78,200 |
| 2022 | $1,650 | $79,500 | $19,400 | $60,100 |
| 2021 | $760 | $79,500 | $19,400 | $60,100 |
| 2020 | $788 | $69,500 | $17,100 | $52,400 |
| 2019 | $748 | $69,500 | $17,100 | $52,400 |
| 2018 | $738 | $64,200 | $14,700 | $49,500 |
| 2017 | $704 | $64,200 | $14,700 | $49,500 |
| 2016 | $684 | $60,600 | $13,700 | $46,900 |
| 2015 | $684 | $60,600 | $13,700 | $46,900 |
| 2014 | $768 | $66,500 | $14,000 | $52,500 |
Source: Public Records
Map
Nearby Homes
- 818 E 25th Ct
- 815 E 25th St
- 903 E 27th Ct
- 2638 E Grand Ave
- 2736 Des Moines St
- 2515 Des Moines St
- 2743 Des Moines St
- 2825 Maple St
- 2814 Des Moines St
- 822 E 29th St
- 2805 Des Moines St
- 2832 Lyon St
- 2540 Capitol Ave
- 1311 E 25th Ct
- 1312 E 25th Ct
- 823 E 23rd Ct
- 807 E 23rd Ct
- 2329 Maple St
- 2441 E Grand Ave
- 2916 Walker St
Your Personal Tour Guide
Ask me questions while you tour the home.