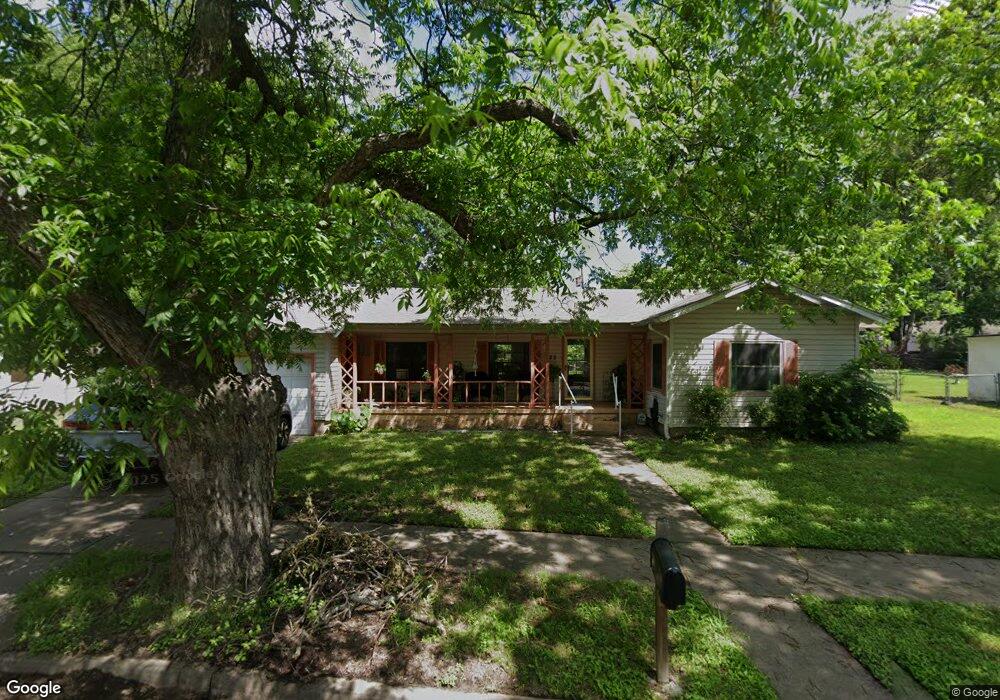
822 Featherston St Cleburne, TX 76033
Estimated Value: $162,019 - $187,000
2
Beds
1
Bath
945
Sq Ft
$187/Sq Ft
Est. Value
About This Home
This home is located at 822 Featherston St, Cleburne, TX 76033 and is currently estimated at $176,505, approximately $186 per square foot. 822 Featherston St is a home located in Johnson County with nearby schools including Coleman Elementary School, Lowell Smith Jr. Middle School, and Cleburne High School.
Ownership History
Date
Name
Owned For
Owner Type
Purchase Details
Closed on
Apr 23, 2025
Sold by
Featherston 822 Land Trust and Szatkowski Matt
Bought by
Carsey Blair Wesley
Current Estimated Value
Home Financials for this Owner
Home Financials are based on the most recent Mortgage that was taken out on this home.
Original Mortgage
$164,400
Outstanding Balance
$163,072
Interest Rate
6.65%
Mortgage Type
Seller Take Back
Estimated Equity
$13,433
Purchase Details
Closed on
Oct 2, 2024
Sold by
Autrey Bobbie L
Bought by
Featherston 822 Land Trust and Szatkowski
Purchase Details
Closed on
Aug 18, 2022
Sold by
Cook Michelle
Bought by
Cook Michelle and Cook Spencer
Purchase Details
Closed on
Jul 1, 2015
Sold by
Deutsche Bank National Trust Co
Bought by
Autrey Bobbie L
Purchase Details
Closed on
Apr 30, 2015
Sold by
Maples Donna and Maples Donna Kay
Bought by
Deutsche Bank National Trust Co
Create a Home Valuation Report for This Property
The Home Valuation Report is an in-depth analysis detailing your home's value as well as a comparison with similar homes in the area
Home Values in the Area
Average Home Value in this Area
Purchase History
| Date | Buyer | Sale Price | Title Company |
|---|---|---|---|
| Carsey Blair Wesley | -- | Corporation Service Company | |
| Featherston 822 Land Trust | -- | None Listed On Document | |
| Cook Michelle | -- | None Listed On Document | |
| Autrey Bobbie L | -- | Servicelink Of Texas Llc | |
| Deutsche Bank National Trust Co | -- | Servicelink |
Source: Public Records
Mortgage History
| Date | Status | Borrower | Loan Amount |
|---|---|---|---|
| Open | Carsey Blair Wesley | $164,400 |
Source: Public Records
Tax History
| Year | Tax Paid | Tax Assessment Tax Assessment Total Assessment is a certain percentage of the fair market value that is determined by local assessors to be the total taxable value of land and additions on the property. | Land | Improvement |
|---|---|---|---|---|
| 2025 | $543 | $141,232 | $36,000 | $105,232 |
| 2024 | $2,506 | $112,410 | $0 | $0 |
| 2023 | $543 | $126,200 | $36,000 | $90,200 |
| 2022 | $2,325 | $126,200 | $36,000 | $90,200 |
| 2021 | $2,204 | $96,182 | $32,000 | $64,182 |
| 2020 | $2,127 | $85,680 | $27,000 | $58,680 |
| 2019 | $2,062 | $85,680 | $27,000 | $58,680 |
| 2018 | $1,876 | $63,452 | $20,000 | $43,452 |
| 2017 | $1,770 | $63,452 | $20,000 | $43,452 |
| 2016 | $1,609 | $54,659 | $15,000 | $39,659 |
| 2015 | $1,182 | $54,659 | $15,000 | $39,659 |
| 2014 | $1,182 | $54,659 | $15,000 | $39,659 |
Source: Public Records
Map
Nearby Homes
- 832 Featherston St
- 911 W Chambers St
- 107 Sunset Dr
- 703 Featherston St
- 206 N Holloway St
- 415 Featherston St
- 504 Featherston St
- 114 S Field St
- 505 W Earl St
- 311 N Pendell Ave
- 611 Forrest Ave
- 306 Prairie Ave
- 1108 Trace Rd
- 405 College St
- 502 Bellevue Dr
- 714 Forrest Ave
- 505 Bellevue Dr
- 1108 Davis St
- 804 Prairie Ave
- 1309 Mcanear Ct
- 824 Featherston St
- 820 Featherston St
- 821 College St
- 826 Featherston St
- 819 College St
- 818 Featherston St
- 823 College St
- 102 Circle Dr
- 817 College St
- 825 College St
- 828 Featherston St
- 825 Featherston St
- 816 Featherston St
- 815 College St
- 827 College St
- 829 Featherston St
- 830 Featherston St
- 101 Circle Dr
- 814 Featherston St
- 106 Circle Dr
Your Personal Tour Guide
Ask me questions while you tour the home.