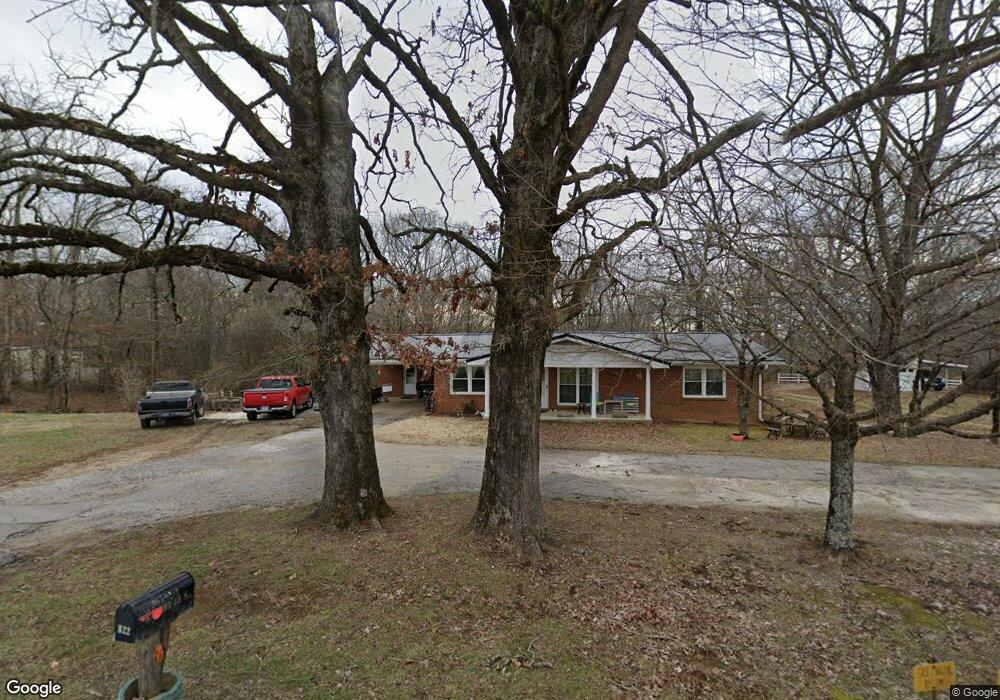
822 Highway 13 S Collinwood, TN 38450
Estimated Value: $143,000 - $174,000
--
Bed
1
Bath
1,623
Sq Ft
$99/Sq Ft
Est. Value
About This Home
This home is located at 822 Highway 13 S, Collinwood, TN 38450 and is currently estimated at $159,897, approximately $98 per square foot. 822 Highway 13 S is a home located in Wayne County.
Ownership History
Date
Name
Owned For
Owner Type
Purchase Details
Closed on
Oct 15, 2021
Sold by
Sherrill Andrew Mark and Sherrill Kristy Lynn
Bought by
Morris Earl and Morris Rebecca
Current Estimated Value
Home Financials for this Owner
Home Financials are based on the most recent Mortgage that was taken out on this home.
Original Mortgage
$70,000
Outstanding Balance
$66,255
Interest Rate
5.9%
Mortgage Type
Purchase Money Mortgage
Estimated Equity
$93,642
Purchase Details
Closed on
Jun 21, 2019
Sold by
Vandygriffe Christy
Bought by
Sherrill Andrew Mark and Sherrill Kristy Lynn
Home Financials for this Owner
Home Financials are based on the most recent Mortgage that was taken out on this home.
Original Mortgage
$123,250
Interest Rate
4%
Mortgage Type
New Conventional
Purchase Details
Closed on
Feb 15, 2012
Sold by
Sherrill Janie Mae
Bought by
Sherrill Andrew Mark and Sherrill Kristy Lynn
Purchase Details
Closed on
Jun 5, 1992
Bought by
Stults Dewey
Purchase Details
Closed on
Feb 10, 1973
Bought by
Stults Dewey and Stults Jewel
Purchase Details
Closed on
Feb 3, 1970
Purchase Details
Closed on
Jan 3, 1900
Create a Home Valuation Report for This Property
The Home Valuation Report is an in-depth analysis detailing your home's value as well as a comparison with similar homes in the area
Home Values in the Area
Average Home Value in this Area
Purchase History
| Date | Buyer | Sale Price | Title Company |
|---|---|---|---|
| Morris Earl | $117,500 | None Available | |
| Sherrill Andrew Mark | $75,000 | -- | |
| Sherrill Andrew Mark | $40,000 | -- | |
| Stults Dewey | $30,000 | -- | |
| Stults Dewey | -- | -- | |
| -- | -- | -- | |
| -- | -- | -- |
Source: Public Records
Mortgage History
| Date | Status | Borrower | Loan Amount |
|---|---|---|---|
| Open | Morris Earl | $70,000 | |
| Previous Owner | Sherrill Andrew Mark | $123,250 |
Source: Public Records
Tax History Compared to Growth
Tax History
| Year | Tax Paid | Tax Assessment Tax Assessment Total Assessment is a certain percentage of the fair market value that is determined by local assessors to be the total taxable value of land and additions on the property. | Land | Improvement |
|---|---|---|---|---|
| 2024 | $715 | $33,000 | $1,750 | $31,250 |
| 2023 | $1,172 | $33,000 | $1,750 | $31,250 |
| 2022 | $1,172 | $33,000 | $1,750 | $31,250 |
| 2021 | $800 | $33,000 | $1,750 | $31,250 |
| 2020 | $800 | $20,350 | $1,750 | $18,600 |
| 2019 | $468 | $20,350 | $1,750 | $18,600 |
| 2018 | $800 | $20,350 | $1,750 | $18,600 |
| 2017 | $800 | $20,350 | $1,750 | $18,600 |
| 2016 | $749 | $20,350 | $1,750 | $18,600 |
| 2014 | $790 | $21,298 | $0 | $0 |
Source: Public Records
Map
Nearby Homes
- 103 S Village Ct
- 103 Daniel Cir
- 200 E Broadway St
- 375 Roanoke Creek Rd
- 411 W Martin Rd
- 1479 Railroad Bed Rd
- 3065 Bucksnort Ridge Rd
- 1344 Railroad Bed Rd
- 1611 Chisholm Rd
- 8276 Middle Butler Rd
- Hughes Farm Rd
- 2055 Chisholm Rd
- 5205 Baptist Hill Rd
- 0 Waterfall Creek Rd
- 0 Downing Hollow Rd
- 2562 Spain Rd
- 1053 Houston Smith Rd
- 4013 Andrews Grocery Rd
- 1 Scott Ridge Rd
- 0 Chisholm Rd
- 820 Highway 13 S
- 818 Highway 13 S
- 814 Highway 13 S
- 910 Highway 13 S
- 837 Highway 13 S
- 201 E Andy St
- 914 Highway 13 S
- 200 E Andy St
- 202 E Andy St
- 925 Highway 13 S
- 104 S Village Ct
- 204 E Andy St
- 923 Highway 13 S
- 207 E Andy St
- 802 Highway 13 S
- 807 Highway 13 S
- 103 W Willie St
- 206 E Andy St
- 922 Highway 13 S
- 209 E Andy St