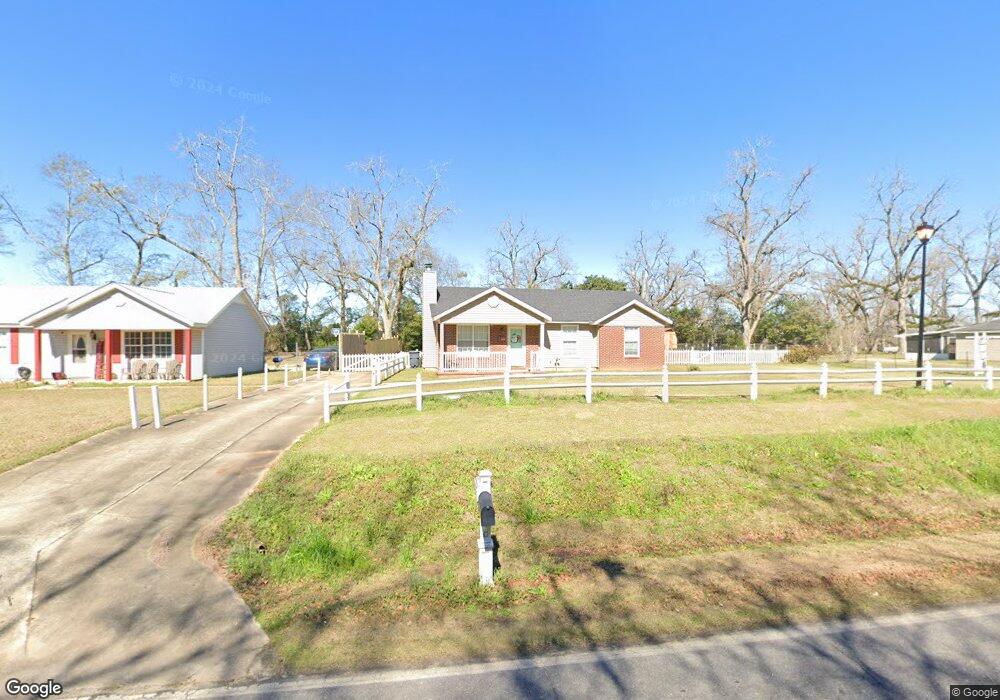
822 John Collins Rd Unit n/a Pelham, GA 31779
Estimated Value: $116,984 - $157,000
3
Beds
2
Baths
1,078
Sq Ft
$123/Sq Ft
Est. Value
About This Home
This home is located at 822 John Collins Rd Unit n/a, Pelham, GA 31779 and is currently estimated at $132,996, approximately $123 per square foot. 822 John Collins Rd Unit n/a is a home located in Mitchell County with nearby schools including Pelham Elementary School, Pelham City Middle School, and Pelham High School.
Ownership History
Date
Name
Owned For
Owner Type
Purchase Details
Closed on
Mar 24, 2017
Sold by
Hud & Housing Of Urban Dev
Bought by
Tyson Lezlie
Current Estimated Value
Home Financials for this Owner
Home Financials are based on the most recent Mortgage that was taken out on this home.
Original Mortgage
$52,370
Outstanding Balance
$43,416
Interest Rate
4.16%
Mortgage Type
New Conventional
Estimated Equity
$89,580
Purchase Details
Closed on
Apr 5, 2016
Bought by
Sec Of Housing & Urban
Purchase Details
Closed on
Nov 7, 2006
Sold by
Hauser Cindy K
Bought by
Griffin William M
Home Financials for this Owner
Home Financials are based on the most recent Mortgage that was taken out on this home.
Original Mortgage
$65,550
Interest Rate
8.8%
Mortgage Type
New Conventional
Create a Home Valuation Report for This Property
The Home Valuation Report is an in-depth analysis detailing your home's value as well as a comparison with similar homes in the area
Home Values in the Area
Average Home Value in this Area
Purchase History
| Date | Buyer | Sale Price | Title Company |
|---|---|---|---|
| Tyson Lezlie | $45,000 | -- | |
| Sec Of Housing & Urban | $65,081 | -- | |
| Quicken Loans Inc | $65,081 | -- | |
| Griffin William M | $69,000 | -- |
Source: Public Records
Mortgage History
| Date | Status | Borrower | Loan Amount |
|---|---|---|---|
| Open | Tyson Lezlie | $52,370 | |
| Previous Owner | Griffin William M | $65,550 |
Source: Public Records
Tax History Compared to Growth
Tax History
| Year | Tax Paid | Tax Assessment Tax Assessment Total Assessment is a certain percentage of the fair market value that is determined by local assessors to be the total taxable value of land and additions on the property. | Land | Improvement |
|---|---|---|---|---|
| 2024 | $1,658 | $39,204 | $2,400 | $36,804 |
| 2023 | $1,663 | $37,884 | $2,400 | $35,484 |
| 2022 | $1,304 | $29,404 | $2,400 | $27,004 |
| 2021 | $1,127 | $26,244 | $2,400 | $23,844 |
| 2020 | $1,081 | $26,244 | $2,400 | $23,844 |
| 2019 | $1,104 | $26,244 | $2,400 | $23,844 |
| 2018 | $1,187 | $26,244 | $2,400 | $23,844 |
| 2017 | $529 | $28,865 | $2,400 | $26,465 |
| 2016 | $549 | $28,865 | $2,400 | $26,465 |
| 2015 | $549 | $28,865 | $2,400 | $26,465 |
| 2014 | $549 | $28,865 | $2,400 | $26,465 |
| 2013 | $549 | $28,864 | $2,400 | $26,464 |
Source: Public Records
Map
Nearby Homes
- 547 Cotton Rd NE
- 482 Curry St NE
- 438 Dogwood Dr NE
- 335 Curry St NE
- 323 Curry St NE
- 375 Baggs Ave SE
- 199 Carroll St NE
- 135 Baggs Ave SE
- 3** Youngs Mill Rd
- 158 Hand Ave W
- 210 Castleberry St NW
- 212 Hand Ave W
- 209 McDonald St SW
- 233 Cannon St NW
- 254 Sapp Ave SW
- 354 Bennett St NW
- 589 Liberia St NW
- 277 Saunders St SW
- 653 Liberia St NW
- 389 Stewart St SW
- 822 John Collins Rd
- 822 John Collins Rd
- 812 John Collins Rd
- 842 John Collins Rd
- 848 John Collins Rd
- 856 John Collins Rd
- 862 John Collins Rd
- 872 John Collins Rd
- 882 John Collins Rd
- 3148 John Collins Rd
- 0 John Collins Rd
- 00 John Collins Rd
- 892 John Collins Rd
- 912 John Collins Rd
- 922 John Collins Rd Unit one
- 922 John Collins Rd
- 932 John Collins Rd
- 760 John Collins Rd
- 664 Cotton Rd NE
- 4183 Ga Highway 93