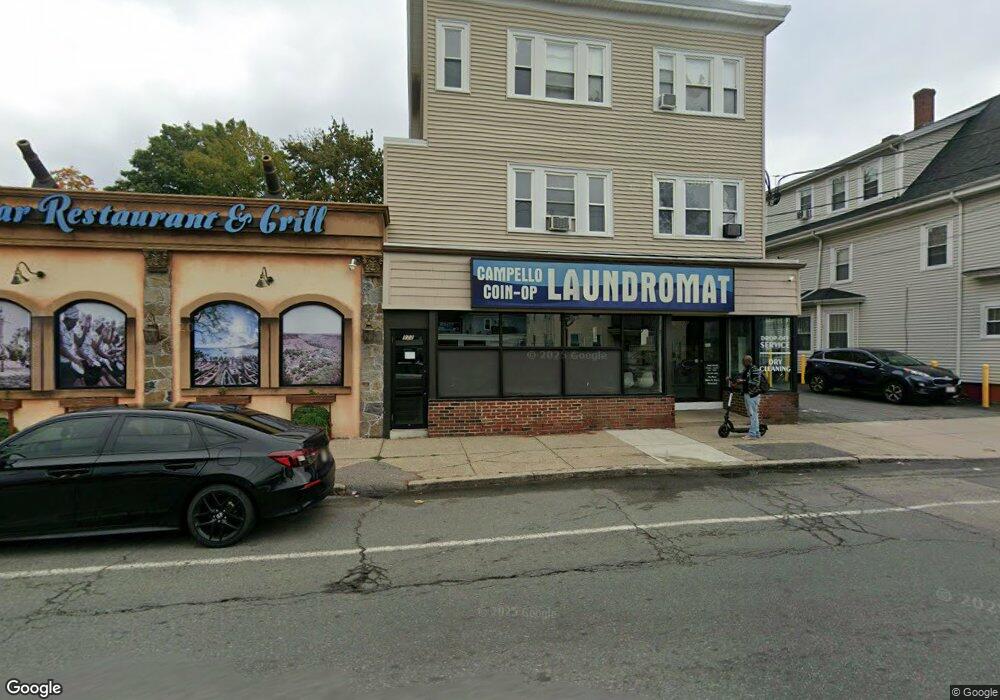
822 Main St Brockton, MA 02301
Clifton Heights Neighborhood
3
Beds
2
Baths
4,335
Sq Ft
5,619
Sq Ft Lot
About This Home
This home is located at 822 Main St, Brockton, MA 02301. 822 Main St is a home located in Plymouth County with nearby schools including Davis K-8 School, John F. Kennedy Elementary School, and South Middle School.
Ownership History
Date
Name
Owned For
Owner Type
Purchase Details
Closed on
Feb 24, 2003
Sold by
Hannigan Rt
Bought by
Main St Rt
Home Financials for this Owner
Home Financials are based on the most recent Mortgage that was taken out on this home.
Original Mortgage
$162,500
Interest Rate
5.98%
Mortgage Type
Commercial
Purchase Details
Closed on
Jun 22, 1995
Sold by
Hannigan John J
Bought by
Hannigan Rt
Home Financials for this Owner
Home Financials are based on the most recent Mortgage that was taken out on this home.
Original Mortgage
$5,000
Interest Rate
7.82%
Mortgage Type
Commercial
Create a Home Valuation Report for This Property
The Home Valuation Report is an in-depth analysis detailing your home's value as well as a comparison with similar homes in the area
Home Values in the Area
Average Home Value in this Area
Purchase History
| Date | Buyer | Sale Price | Title Company |
|---|---|---|---|
| Main St Rt | $118,000 | -- | |
| Hannigan Rt | -- | -- | |
| Hannigan Rt | $20,000 | -- |
Source: Public Records
Mortgage History
| Date | Status | Borrower | Loan Amount |
|---|---|---|---|
| Open | Hannigan Rt | $130,000 | |
| Closed | Hannigan Rt | $162,500 | |
| Previous Owner | Hannigan Rt | $5,000 |
Source: Public Records
Tax History Compared to Growth
Tax History
| Year | Tax Paid | Tax Assessment Tax Assessment Total Assessment is a certain percentage of the fair market value that is determined by local assessors to be the total taxable value of land and additions on the property. | Land | Improvement |
|---|---|---|---|---|
| 2025 | -- | $434,800 | $153,000 | $281,800 |
| 2024 | -- | $426,700 | $139,100 | $287,600 |
| 2023 | $0 | $377,900 | $109,000 | $268,900 |
| 2022 | $0 | $348,600 | $109,000 | $239,600 |
| 2021 | $0 | $329,400 | $103,800 | $225,600 |
| 2020 | $0 | $330,300 | $98,900 | $231,400 |
| 2019 | $0 | $282,100 | $98,900 | $183,200 |
| 2018 | $0 | $274,900 | $98,900 | $176,000 |
| 2017 | $0 | $251,100 | $98,900 | $152,200 |
| 2016 | -- | $209,300 | $98,880 | $110,420 |
| 2015 | -- | $209,300 | $98,880 | $110,420 |
| 2014 | -- | $209,300 | $98,880 | $110,420 |
Source: Public Records
Map
Nearby Homes