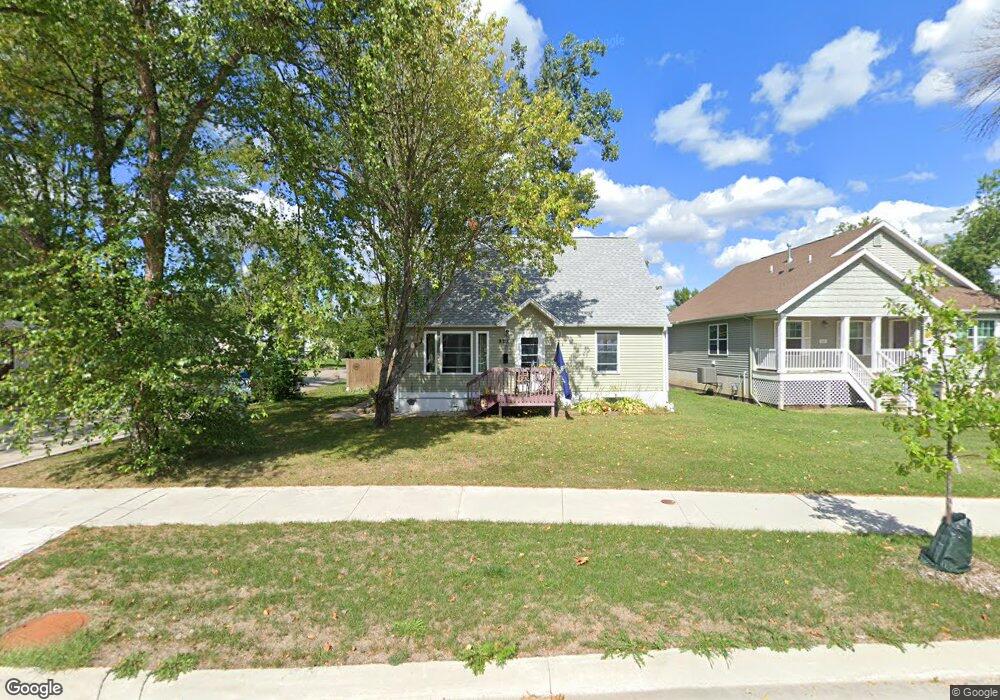
822 O Ave NW Cedar Rapids, IA 52405
Northwest Area NeighborhoodEstimated Value: $166,000 - $178,000
3
Beds
2
Baths
1,494
Sq Ft
$114/Sq Ft
Est. Value
About This Home
This home is located at 822 O Ave NW, Cedar Rapids, IA 52405 and is currently estimated at $170,514, approximately $114 per square foot. 822 O Ave NW is a home located in Linn County with nearby schools including Harrison Elementary School, Roosevelt Creative Corridor Business Academy, and John F. Kennedy High School.
Ownership History
Date
Name
Owned For
Owner Type
Purchase Details
Closed on
Dec 14, 2010
Sold by
Bunker Harland C and Bunker Cindy L
Bought by
Parham Samantha R
Current Estimated Value
Home Financials for this Owner
Home Financials are based on the most recent Mortgage that was taken out on this home.
Original Mortgage
$94,435
Outstanding Balance
$62,391
Interest Rate
4.22%
Mortgage Type
FHA
Estimated Equity
$108,123
Purchase Details
Closed on
May 19, 2010
Sold by
Thompson Mark A and Thompson Loraine O
Bought by
Bunker Harland C and Bunker Cindy L
Home Financials for this Owner
Home Financials are based on the most recent Mortgage that was taken out on this home.
Original Mortgage
$75,962
Interest Rate
4.5%
Mortgage Type
New Conventional
Purchase Details
Closed on
Jul 27, 1998
Sold by
Thompson Connie M
Bought by
Thompson Mark A
Home Financials for this Owner
Home Financials are based on the most recent Mortgage that was taken out on this home.
Original Mortgage
$62,050
Interest Rate
7.03%
Create a Home Valuation Report for This Property
The Home Valuation Report is an in-depth analysis detailing your home's value as well as a comparison with similar homes in the area
Home Values in the Area
Average Home Value in this Area
Purchase History
| Date | Buyer | Sale Price | Title Company |
|---|---|---|---|
| Parham Samantha R | $98,500 | None Available | |
| Bunker Harland C | $42,500 | None Available | |
| Thompson Mark A | -- | -- |
Source: Public Records
Mortgage History
| Date | Status | Borrower | Loan Amount |
|---|---|---|---|
| Open | Parham Samantha R | $94,435 | |
| Previous Owner | Bunker Harland C | $75,962 | |
| Previous Owner | Thompson Mark A | $62,050 |
Source: Public Records
Tax History Compared to Growth
Tax History
| Year | Tax Paid | Tax Assessment Tax Assessment Total Assessment is a certain percentage of the fair market value that is determined by local assessors to be the total taxable value of land and additions on the property. | Land | Improvement |
|---|---|---|---|---|
| 2025 | $2,316 | $154,200 | $26,700 | $127,500 |
| 2024 | $2,420 | $141,300 | $22,200 | $119,100 |
| 2023 | $2,420 | $141,300 | $22,200 | $119,100 |
| 2022 | $2,114 | $123,600 | $22,200 | $101,400 |
| 2021 | $2,140 | $111,000 | $20,000 | $91,000 |
| 2020 | $2,140 | $105,600 | $20,000 | $85,600 |
| 2019 | $1,828 | $93,300 | $17,800 | $75,500 |
| 2018 | $1,700 | $93,300 | $17,800 | $75,500 |
| 2017 | $1,847 | $89,200 | $17,800 | $71,400 |
| 2016 | $1,847 | $86,900 | $17,800 | $69,100 |
| 2015 | $1,739 | $81,724 | $17,773 | $63,951 |
| 2014 | $1,554 | $64,126 | $17,773 | $46,353 |
| 2013 | $1,150 | $64,126 | $17,773 | $46,353 |
Source: Public Records
Map
Nearby Homes
- 1600 8th St NW
- 927 O Ave NW
- 1238 Ellis Blvd NW
- 1301 11th St NW
- 1871 Ellis Blvd NW Unit 202
- 1871 Ellis Blvd NW Unit 205
- 1424 N Ave NW
- 1130 13th St NW
- 1126 13th St NW
- 1016 H Ave NW
- 1427 Pawnee Dr NW
- 816 9th St NW
- 820 10th St NW
- 1015 Pawnee Dr NW
- 726 G Ave NW
- 1026 G Ave NW
- 1705 Hidden Hollow Ln NW
- 1613 Whitters Way NW
- 716 Ellis Blvd NW
- 1073 G Ave NW