Estimated Value: $245,037 - $265,000
2
Beds
2
Baths
985
Sq Ft
$259/Sq Ft
Est. Value
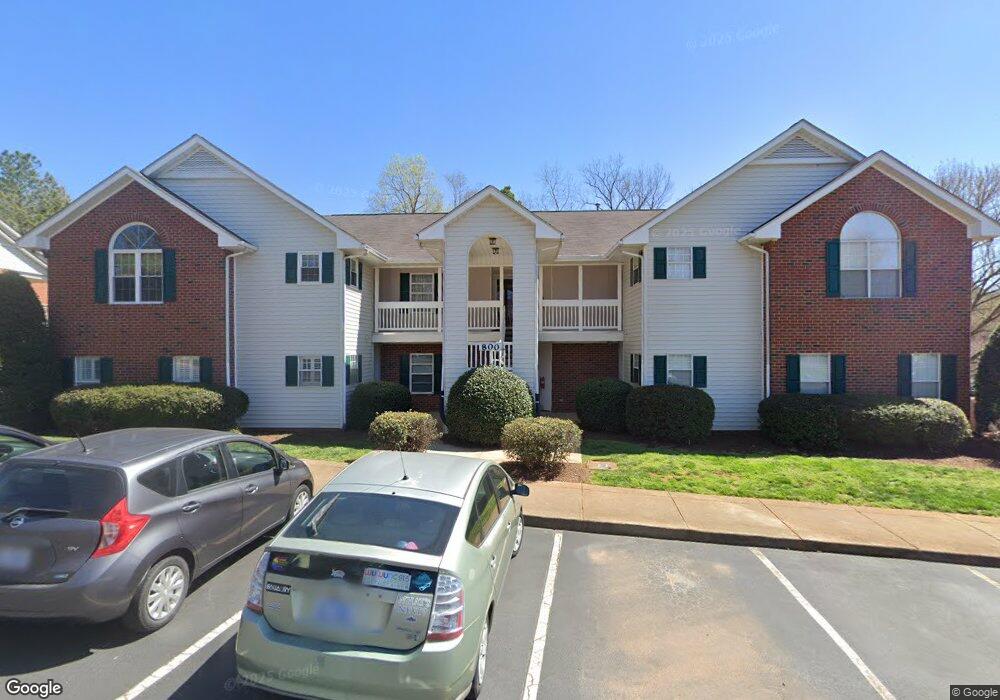
About This Home
This home is located at 822 Renshaw Ct Unit 2nd Floor CNTR, Cary, NC 27518 and is currently estimated at $255,509, approximately $259 per square foot. 822 Renshaw Ct Unit 2nd Floor CNTR is a home located in Wake County with nearby schools including Dillard Drive Magnet Elementary School, Dillard Drive Magnet Middle School, and Resurrection Lutheran School.
Ownership History
Date
Name
Owned For
Owner Type
Purchase Details
Closed on
Oct 12, 2018
Sold by
Mejia Elvia
Bought by
Chriscoe Charity
Current Estimated Value
Home Financials for this Owner
Home Financials are based on the most recent Mortgage that was taken out on this home.
Original Mortgage
$108,000
Outstanding Balance
$92,872
Interest Rate
3.87%
Mortgage Type
Adjustable Rate Mortgage/ARM
Estimated Equity
$162,637
Purchase Details
Closed on
Jul 9, 2007
Sold by
Shuler Max Kemper
Bought by
Mejia Elvia
Home Financials for this Owner
Home Financials are based on the most recent Mortgage that was taken out on this home.
Original Mortgage
$77,600
Interest Rate
6.35%
Mortgage Type
Unknown
Purchase Details
Closed on
Dec 31, 1998
Sold by
Archer Amy Alana
Bought by
Shuler Max Kemper
Home Financials for this Owner
Home Financials are based on the most recent Mortgage that was taken out on this home.
Original Mortgage
$91,088
Interest Rate
6.72%
Create a Home Valuation Report for This Property
The Home Valuation Report is an in-depth analysis detailing your home's value as well as a comparison with similar homes in the area
Home Values in the Area
Average Home Value in this Area
Purchase History
| Date | Buyer | Sale Price | Title Company |
|---|---|---|---|
| Chriscoe Charity | $140,000 | None Available | |
| Mejia Elvia | $97,000 | None Available | |
| Shuler Max Kemper | $99,000 | -- |
Source: Public Records
Mortgage History
| Date | Status | Borrower | Loan Amount |
|---|---|---|---|
| Open | Chriscoe Charity | $108,000 | |
| Previous Owner | Mejia Elvia | $77,600 | |
| Previous Owner | Mejia Elvia | $14,550 | |
| Previous Owner | Shuler Max Kemper | $91,088 |
Source: Public Records
Tax History Compared to Growth
Tax History
| Year | Tax Paid | Tax Assessment Tax Assessment Total Assessment is a certain percentage of the fair market value that is determined by local assessors to be the total taxable value of land and additions on the property. | Land | Improvement |
|---|---|---|---|---|
| 2025 | $2,040 | $235,661 | -- | $235,661 |
| 2024 | $1,996 | $235,661 | $0 | $235,661 |
| 2023 | $1,619 | $159,587 | $0 | $159,587 |
| 2022 | $1,559 | $159,587 | $0 | $159,587 |
| 2021 | $1,528 | $159,587 | $0 | $159,587 |
| 2020 | $1,536 | $159,587 | $0 | $159,587 |
| 2019 | $1,205 | $110,701 | $0 | $110,701 |
| 2018 | $1,132 | $110,701 | $0 | $110,701 |
| 2017 | $1,088 | $110,701 | $0 | $110,701 |
| 2016 | $1,072 | $110,701 | $0 | $110,701 |
| 2015 | $1,050 | $104,654 | $0 | $104,654 |
| 2014 | $991 | $104,654 | $0 | $104,654 |
Source: Public Records
Map
Nearby Homes
- 1221 Renshaw Ct
- 304 W Kirkfield Dr
- 4311 Wellington Ridge Loop
- 2414 Stephens Rd
- 1641 Kildonan Place
- 307 Durington Place
- 1640 Glengarry Dr
- 0 SE Cary Pkwy Unit 2491180
- 104 Catherwood Place
- 2434 Stephens Rd
- 311 Dunhagan Place
- 6315 Tryon Rd
- 301 Dunhagan Place
- 1331 Kingston Ridge Rd
- 105 Crosswaite Way
- 109 Beaver Pine Way
- 105 Headlands Ln
- 2015 Piney Plains Rd
- 121 Bay Dr
- 208 Lawrence Rd
- 822 Renshaw Ct
- 812 Renshaw Ct
- 812 Renshaw Ct Unit 812
- 823 Renshaw Ct Unit 823
- 821 Renshaw Ct Unit 821
- 823 Renshaw Ct
- 821 Renshaw Ct
- 813 Renshaw Ct
- 1623 Bulon Dr
- 1622 Bulon Dr
- 1621 Bulon Dr
- 1612 Bulon Dr Unit 5
- 1611 Bulon Dr
- 1012 Renshaw Ct
- 1023 Renshaw Ct
- 1021 Renshaw Ct
- 1013 Renshaw Ct
- 1011 Renshaw Ct
- 1013 Renshaw Ct Unit Bldg1,1stFlr,Rt
- 1022 Renshaw Ct