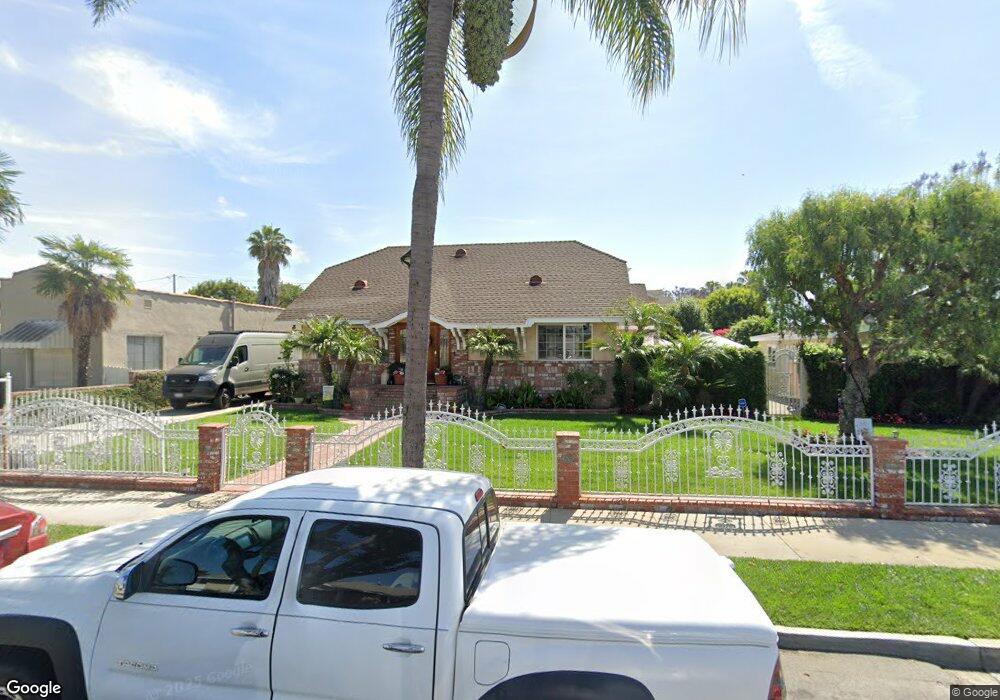
822 S Burris Ave Compton, CA 90221
Estimated Value: $718,000 - $1,313,496
8
Beds
5
Baths
4,978
Sq Ft
$206/Sq Ft
Est. Value
About This Home
This home is located at 822 S Burris Ave, Compton, CA 90221 and is currently estimated at $1,026,374, approximately $206 per square foot. 822 S Burris Ave is a home located in Los Angeles County with nearby schools including Emerson Elementary School, Roosevelt Middle School, and Dominguez High School.
Ownership History
Date
Name
Owned For
Owner Type
Purchase Details
Closed on
Mar 28, 2003
Sold by
Fountain April Limbrick and Fountain Kenneth
Bought by
Limbrick Fountain Kenneth and Limbrick Fountain April
Current Estimated Value
Home Financials for this Owner
Home Financials are based on the most recent Mortgage that was taken out on this home.
Original Mortgage
$150,000
Outstanding Balance
$64,581
Interest Rate
5.78%
Estimated Equity
$961,793
Purchase Details
Closed on
Dec 30, 2000
Sold by
Limbrick April L
Bought by
Fountain Kenneth and Limbrick April L
Purchase Details
Closed on
Apr 17, 2000
Sold by
Aames Capital Corp
Bought by
Limbrick April L
Home Financials for this Owner
Home Financials are based on the most recent Mortgage that was taken out on this home.
Original Mortgage
$130,625
Interest Rate
8.22%
Purchase Details
Closed on
Oct 14, 1999
Sold by
Smith Pauline E
Bought by
Aames Capital Corp
Create a Home Valuation Report for This Property
The Home Valuation Report is an in-depth analysis detailing your home's value as well as a comparison with similar homes in the area
Home Values in the Area
Average Home Value in this Area
Purchase History
| Date | Buyer | Sale Price | Title Company |
|---|---|---|---|
| Limbrick Fountain Kenneth | -- | Chicago Title | |
| Fountain Kenneth | -- | -- | |
| Limbrick April L | $137,500 | First American Title Co | |
| Aames Capital Corp | $121,410 | Orange Coast Title |
Source: Public Records
Mortgage History
| Date | Status | Borrower | Loan Amount |
|---|---|---|---|
| Open | Limbrick Fountain Kenneth | $150,000 | |
| Closed | Limbrick April L | $130,625 |
Source: Public Records
Tax History
| Year | Tax Paid | Tax Assessment Tax Assessment Total Assessment is a certain percentage of the fair market value that is determined by local assessors to be the total taxable value of land and additions on the property. | Land | Improvement |
|---|---|---|---|---|
| 2025 | $10,162 | $548,602 | $114,643 | $433,959 |
| 2024 | $10,162 | $537,846 | $112,396 | $425,450 |
| 2023 | $10,036 | $527,301 | $110,193 | $417,108 |
| 2022 | $9,163 | $516,963 | $108,033 | $408,930 |
| 2021 | $9,227 | $506,827 | $105,915 | $400,912 |
| 2020 | $9,065 | $501,631 | $104,829 | $396,802 |
| 2019 | $8,964 | $491,796 | $102,774 | $389,022 |
| 2018 | $8,614 | $482,154 | $100,759 | $381,395 |
| 2016 | $8,158 | $463,434 | $96,848 | $366,586 |
| 2015 | $7,800 | $456,474 | $95,394 | $361,080 |
| 2014 | $7,658 | $447,533 | $93,526 | $354,007 |
Source: Public Records
Map
Nearby Homes
- 621 S Burris Ave
- 1301 E Alondra Blvd
- 718 S Poinsettia Ave
- 805 S Crane Ave
- 822 S Chester Ave
- 423 S Poinsettia Ave
- 2416 E Alondra Blvd
- 1100 E Tichenor St
- 501 S Pearl Ave
- 404 S Poinsettia Ave
- 1300 S California Ave
- 3625 E Marcelle St
- 211 S Poinsettia Ave
- 405 S Ward Ave
- 1423 S Sloan Ave
- 110 S Sloan Ave
- 212 S Santa fe Ave
- 511 S Pannes Ave
- 1540 S Pearl Ave
- 229 E Reeve St
- 818 S Burris Ave
- 814 S Burris Ave
- 821 S Sloan Ave
- 825 S Sloan Ave
- 817 S Sloan Ave
- 825 S Burris Ave
- 808 S Burris Ave
- 821 S Burris Ave
- 817 S Burris Ave
- 809 S Sloan Ave
- 804 S Burris Ave
- 1011 E Alondra Blvd
- 811 S Burris Ave
- 811 S Burris Ave
- 805 S Sloan Ave
- 802 S Burris Ave
- 801 S Sloan Ave
- 805 S Burris Ave
- 720 S Burris Ave
- 830 S Mayo Ave
Your Personal Tour Guide
Ask me questions while you tour the home.