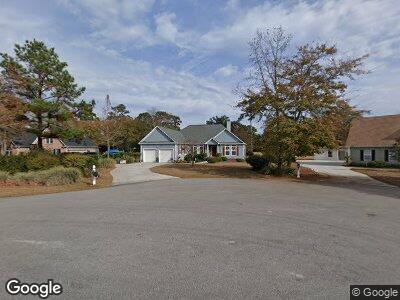
822 S Green Tee Rd Hampstead, NC 28443
Estimated Value: $484,442 - $556,000
3
Beds
2
Baths
2,046
Sq Ft
$258/Sq Ft
Est. Value
About This Home
This home is located at 822 S Green Tee Rd, Hampstead, NC 28443 and is currently estimated at $528,611, approximately $258 per square foot. 822 S Green Tee Rd is a home located in Pender County with nearby schools including Topsail Elementary School, Topsail Middle School, and Topsail High School.
Ownership History
Date
Name
Owned For
Owner Type
Purchase Details
Closed on
Aug 28, 2019
Sold by
Payne Kathleen Bonney and Payne Randall Warner
Bought by
Mcelhone Michael A and Mcelhone Patricia A
Current Estimated Value
Purchase Details
Closed on
Feb 12, 2016
Sold by
Bonney Richard Condon and Bonney Christina Absi
Bought by
Payne Kathleen Bonney and Bonney Brian P
Home Financials for this Owner
Home Financials are based on the most recent Mortgage that was taken out on this home.
Original Mortgage
$240,800
Interest Rate
3.79%
Mortgage Type
New Conventional
Purchase Details
Closed on
Dec 20, 2006
Sold by
Bonney Dick and Bonney Meryl
Bought by
Bonney Richard C and Bonney Brian P
Home Financials for this Owner
Home Financials are based on the most recent Mortgage that was taken out on this home.
Original Mortgage
$200,000
Interest Rate
6.19%
Mortgage Type
New Conventional
Create a Home Valuation Report for This Property
The Home Valuation Report is an in-depth analysis detailing your home's value as well as a comparison with similar homes in the area
Home Values in the Area
Average Home Value in this Area
Purchase History
| Date | Buyer | Sale Price | Title Company |
|---|---|---|---|
| Mcelhone Michael A | $280,000 | None Available | |
| Payne Kathleen Bonney | -- | None Available | |
| Bonney Richard C | -- | -- |
Source: Public Records
Mortgage History
| Date | Status | Borrower | Loan Amount |
|---|---|---|---|
| Previous Owner | Payne Kathleen Bonney | $240,800 | |
| Previous Owner | Bonney Richard C | $200,000 |
Source: Public Records
Tax History Compared to Growth
Tax History
| Year | Tax Paid | Tax Assessment Tax Assessment Total Assessment is a certain percentage of the fair market value that is determined by local assessors to be the total taxable value of land and additions on the property. | Land | Improvement |
|---|---|---|---|---|
| 2024 | $2,919 | $293,946 | $85,908 | $208,038 |
| 2023 | $2,919 | $293,946 | $85,908 | $208,038 |
| 2022 | $2,667 | $293,946 | $85,908 | $208,038 |
| 2021 | $2,667 | $293,946 | $85,908 | $208,038 |
| 2020 | $2,667 | $293,946 | $85,908 | $208,038 |
| 2019 | $2,667 | $293,946 | $85,908 | $208,038 |
| 2018 | $2,625 | $275,697 | $110,000 | $165,697 |
| 2017 | $2,625 | $275,697 | $110,000 | $165,697 |
| 2016 | $2,598 | $275,697 | $110,000 | $165,697 |
| 2015 | $2,563 | $275,697 | $110,000 | $165,697 |
| 2014 | $2,019 | $275,697 | $110,000 | $165,697 |
| 2013 | -- | $275,697 | $110,000 | $165,697 |
| 2012 | -- | $275,697 | $110,000 | $165,697 |
Source: Public Records
Map
Nearby Homes
- 658 Sawgrass Rd
- 146 Olde Point Rd
- 708 Cordgrass Rd
- 709 Sawgrass Rd
- 802 Sarah Ln
- 792 Kings Landing Rd
- 1656 Kings Landing Rd
- 48 Streambed Way
- 707 Brown Pelican Ln
- 39 Streambed Way
- 159 Emerald Ridge Dr
- 96 Ransom Dr
- 1629 Kings Landing Rd
- 605 Ravenswood Rd
- 101 Marshview Rd
- 316 Emerald Ridge Dr
- 1224 Kings Landing Rd
- 205 Sand Dollar Ln
- 124 Golf Terrace Dr
- 350 Emerald Ridge Dr
- 822 S Green Tee Rd
- 820 S Green Tee Rd
- 824 S Green Tee Rd
- 816 S Green Tee Rd
- 825 S Green Tee Rd
- 821 S Green Tee Rd
- 819 S Green Tee Rd
- 823 S Green Tee Rd
- 823 S Green Tee Rd
- 817 S Green Tee Rd
- 815 S Green Tee Rd
- 812 S Green Tee Rd
- 646 Sawgrass Rd
- 644 Sawgrass Rd
- 813 S Green Tee Rd
- 642 Sawgrass Rd
- 620 Sawgrass Rd
- 622 Sawgrass Rd
- 618 Sawgrass Rd
- 616 Sawgrass Rd