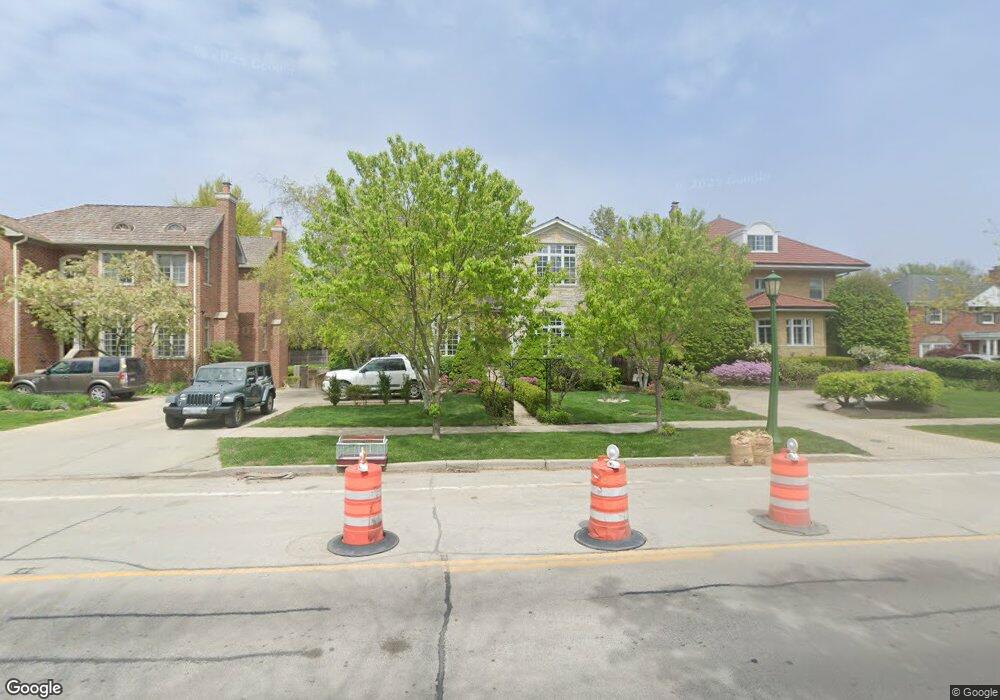
822 Sheridan Rd Wilmette, IL 60091
Estimated Value: $2,181,000 - $2,458,000
4
Beds
5
Baths
4,034
Sq Ft
$580/Sq Ft
Est. Value
About This Home
This home is located at 822 Sheridan Rd, Wilmette, IL 60091 and is currently estimated at $2,338,000, approximately $579 per square foot. 822 Sheridan Rd is a home located in Cook County with nearby schools including Central Elementary School, Highcrest Middle School, and Wilmette Junior High School.
Ownership History
Date
Name
Owned For
Owner Type
Purchase Details
Closed on
Mar 18, 2005
Sold by
New Palladio Group Llc
Bought by
Smale Kevin and Altieri Michelle
Current Estimated Value
Home Financials for this Owner
Home Financials are based on the most recent Mortgage that was taken out on this home.
Original Mortgage
$825,000
Outstanding Balance
$425,988
Interest Rate
5.89%
Mortgage Type
Unknown
Estimated Equity
$1,912,012
Purchase Details
Closed on
Jan 3, 2002
Sold by
Marks James G
Bought by
New Palladio Group Llc
Home Financials for this Owner
Home Financials are based on the most recent Mortgage that was taken out on this home.
Original Mortgage
$5,225,000
Interest Rate
4.75%
Mortgage Type
Construction
Create a Home Valuation Report for This Property
The Home Valuation Report is an in-depth analysis detailing your home's value as well as a comparison with similar homes in the area
Home Values in the Area
Average Home Value in this Area
Purchase History
| Date | Buyer | Sale Price | Title Company |
|---|---|---|---|
| Smale Kevin | $1,942,000 | Chicago Title Insurance Comp | |
| New Palladio Group Llc | $1,350,000 | -- |
Source: Public Records
Mortgage History
| Date | Status | Borrower | Loan Amount |
|---|---|---|---|
| Open | Smale Kevin | $825,000 | |
| Previous Owner | New Palladio Group Llc | $5,225,000 |
Source: Public Records
Tax History Compared to Growth
Tax History
| Year | Tax Paid | Tax Assessment Tax Assessment Total Assessment is a certain percentage of the fair market value that is determined by local assessors to be the total taxable value of land and additions on the property. | Land | Improvement |
|---|---|---|---|---|
| 2024 | $36,431 | $163,864 | $30,822 | $133,042 |
| 2023 | $34,459 | $163,864 | $30,822 | $133,042 |
| 2022 | $34,459 | $163,864 | $30,822 | $133,042 |
| 2021 | $33,675 | $132,951 | $29,721 | $103,230 |
| 2020 | $33,183 | $132,951 | $29,721 | $103,230 |
| 2019 | $34,525 | $154,775 | $29,721 | $125,054 |
| 2018 | $28,564 | $123,500 | $24,217 | $99,283 |
| 2017 | $37,482 | $165,407 | $24,217 | $141,190 |
| 2016 | $37,444 | $174,766 | $24,217 | $150,549 |
| 2015 | $27,267 | $112,458 | $22,016 | $90,442 |
| 2014 | $29,910 | $125,000 | $22,016 | $102,984 |
| 2013 | $28,550 | $125,000 | $22,016 | $102,984 |
Source: Public Records
Map
Nearby Homes
- 315 Washington Ave
- 900 Sheridan Rd
- 512 Elmwood Ave
- 526 Linden Ave
- 250 3rd St
- 1025 Central Ave
- 2741 Eastwood Ave
- 901 Westerfield Dr
- 2754 Ridge Ave
- 1616 Sheridan Rd Unit 9H
- 724 12th St Unit 105
- 1630 Sheridan Rd Unit 5K
- 1630 Sheridan Rd Unit 2F
- 1630 Sheridan Rd Unit 2N
- 1630 Sheridan Rd Unit 2J
- 1142 Oakwood Ave
- 621 Green Bay Rd
- 1209 Maple Ave
- 410 Prairie Ave
- 736 Central St
- 814 Sheridan Rd
- 824 Sheridan Rd
- 828 Sheridan Rd
- 808 Sheridan Rd
- 832 Sheridan Rd
- 819 Michigan Ave
- 825 Michigan Ave
- 813 Michigan Ave
- 831 Michigan Ave
- 800 Sheridan Rd
- 836 Sheridan Rd
- 809 Michigan Ave
- 320 Washington Ave
- 821 Sheridan Rd
- 835 Michigan Ave
- 829 Sheridan Rd
- 842 Sheridan Rd
- 803 Michigan Ave
- 835 Sheridan Rd
- 845 Michigan Ave