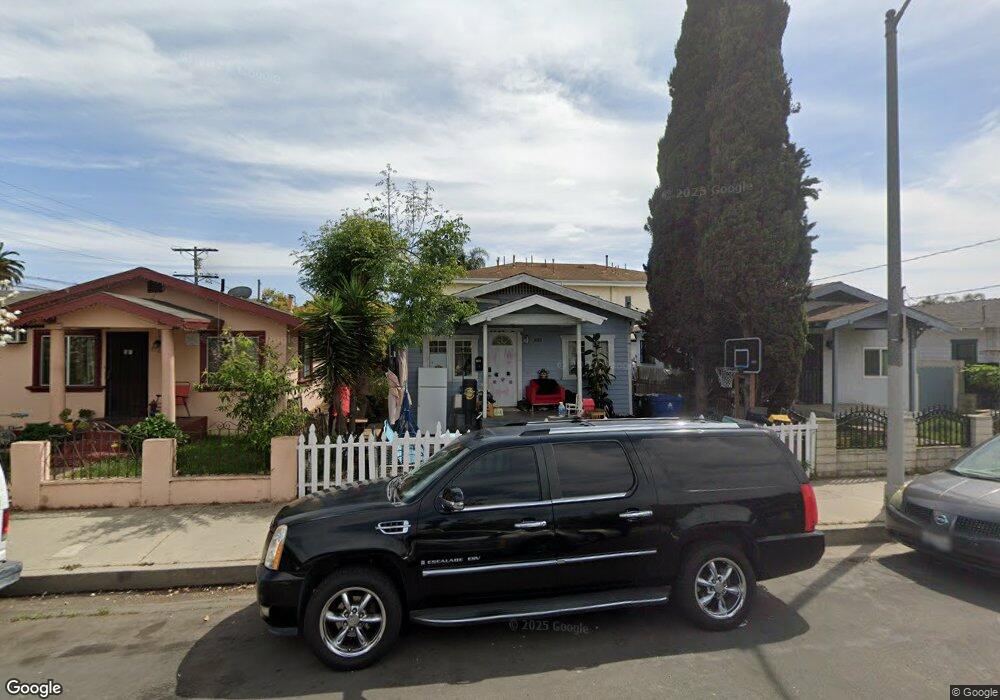
822 W I St Wilmington, CA 90744
Estimated Value: $456,000 - $666,000
1
Bed
1
Bath
440
Sq Ft
$1,242/Sq Ft
Est. Value
About This Home
This home is located at 822 W I St, Wilmington, CA 90744 and is currently estimated at $546,645, approximately $1,242 per square foot. 822 W I St is a home located in Los Angeles County with nearby schools including George De La Torre Jr. Elementary, Phineas Banning Senior High School, and Sts. Peter And St. Paul School.
Ownership History
Date
Name
Owned For
Owner Type
Purchase Details
Closed on
Mar 26, 2025
Sold by
Rosen Riki W and Wakeland Riki L
Bought by
Riki L Wakeland Trust and Wakeland
Current Estimated Value
Purchase Details
Closed on
Mar 6, 2019
Sold by
Tippmann Donald
Bought by
Tippmann Joseph
Purchase Details
Closed on
Aug 9, 2007
Sold by
Tippmann Marie P
Bought by
Tippmann Donald J
Home Financials for this Owner
Home Financials are based on the most recent Mortgage that was taken out on this home.
Original Mortgage
$19,300
Interest Rate
6.73%
Mortgage Type
Stand Alone Second
Purchase Details
Closed on
Jul 17, 2007
Sold by
Lewis Iva J and Lewis Family Trust
Bought by
Tippmann Donald J
Home Financials for this Owner
Home Financials are based on the most recent Mortgage that was taken out on this home.
Original Mortgage
$19,300
Interest Rate
6.73%
Mortgage Type
Stand Alone Second
Create a Home Valuation Report for This Property
The Home Valuation Report is an in-depth analysis detailing your home's value as well as a comparison with similar homes in the area
Home Values in the Area
Average Home Value in this Area
Purchase History
| Date | Buyer | Sale Price | Title Company |
|---|---|---|---|
| Riki L Wakeland Trust | -- | None Listed On Document | |
| Tippmann Joseph | -- | None Available | |
| Tippmann Joseph D | -- | None Available | |
| Tippmann Donald J | -- | Fidelity National Title Co | |
| Tippmann Donald J | $193,000 | Fidelity National Title Co |
Source: Public Records
Mortgage History
| Date | Status | Borrower | Loan Amount |
|---|---|---|---|
| Previous Owner | Tippmann Donald J | $19,300 | |
| Previous Owner | Tippmann Donald J | $154,400 |
Source: Public Records
Tax History Compared to Growth
Tax History
| Year | Tax Paid | Tax Assessment Tax Assessment Total Assessment is a certain percentage of the fair market value that is determined by local assessors to be the total taxable value of land and additions on the property. | Land | Improvement |
|---|---|---|---|---|
| 2025 | $3,608 | $295,606 | $223,101 | $72,505 |
| 2024 | $3,608 | $289,811 | $218,727 | $71,084 |
| 2023 | $3,539 | $284,130 | $214,439 | $69,691 |
| 2022 | $3,373 | $278,560 | $210,235 | $68,325 |
| 2021 | $3,333 | $273,099 | $206,113 | $66,986 |
| 2019 | $452 | $227,247 | $158,957 | $68,290 |
| 2018 | $2,769 | $222,792 | $155,841 | $66,951 |
| 2016 | $2,646 | $214,143 | $149,791 | $64,352 |
| 2015 | $2,608 | $210,927 | $147,541 | $63,386 |
| 2014 | $1,626 | $125,000 | $87,400 | $37,600 |
Source: Public Records
Map
Nearby Homes
- 1305 W I St
- 1301 W I St
- 918 McDonald Ave
- 710 W Anaheim St
- 1034 Ronan Ave
- 705 McDonald Ave
- 1011 N Wilmington Blvd
- 923 W G St Unit 8
- 909 W Denni St
- 801 W F St
- 933 Island Ave
- 1043 Lagoon Ave
- 524 Gulf Ave
- 910 Craven St
- 329 Ross Place
- 323 Ross Place
- 503 W Denni St
- 1112 Island Ave
- 203 W Opp St
- 1306 Gulf Ave