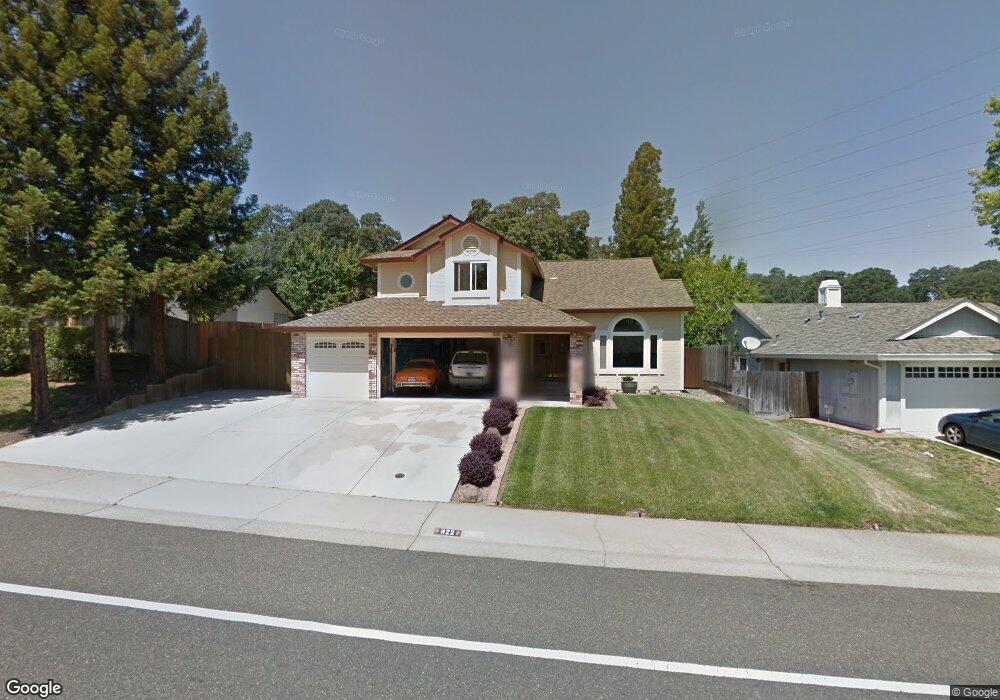
822 Willow Creek Dr Folsom, CA 95630
Briggs Ranch NeighborhoodEstimated Value: $735,013 - $854,000
4
Beds
3
Baths
2,076
Sq Ft
$381/Sq Ft
Est. Value
About This Home
This home is located at 822 Willow Creek Dr, Folsom, CA 95630 and is currently estimated at $790,253, approximately $380 per square foot. 822 Willow Creek Dr is a home located in Sacramento County with nearby schools including Folsom Hills Elementary School, Folsom Middle School, and Vista Del Lago High School.
Ownership History
Date
Name
Owned For
Owner Type
Purchase Details
Closed on
Jun 11, 2009
Sold by
Schlosser Timothy J and Schlosser Andra C
Bought by
Candelaria James J and Candelaria Carol A
Current Estimated Value
Home Financials for this Owner
Home Financials are based on the most recent Mortgage that was taken out on this home.
Original Mortgage
$215,000
Interest Rate
4.82%
Mortgage Type
Purchase Money Mortgage
Purchase Details
Closed on
May 21, 2003
Sold by
Carter Phillip E and Carter Lentice M
Bought by
Schlosser Timothy J and Schlosser Andra C
Home Financials for this Owner
Home Financials are based on the most recent Mortgage that was taken out on this home.
Original Mortgage
$299,700
Interest Rate
5.75%
Mortgage Type
Purchase Money Mortgage
Purchase Details
Closed on
Mar 29, 1995
Sold by
Danford Jeffrey L and Danford Anita
Bought by
Carter Phillip E and Carter Lentice M
Home Financials for this Owner
Home Financials are based on the most recent Mortgage that was taken out on this home.
Original Mortgage
$204,548
Interest Rate
8.9%
Create a Home Valuation Report for This Property
The Home Valuation Report is an in-depth analysis detailing your home's value as well as a comparison with similar homes in the area
Home Values in the Area
Average Home Value in this Area
Purchase History
| Date | Buyer | Sale Price | Title Company |
|---|---|---|---|
| Candelaria James J | $390,000 | Fidelity National Title Co | |
| Schlosser Timothy J | $333,000 | Fidelity National Title Co | |
| Carter Phillip E | $228,000 | Chicago Title Company |
Source: Public Records
Mortgage History
| Date | Status | Borrower | Loan Amount |
|---|---|---|---|
| Closed | Candelaria James J | $215,000 | |
| Previous Owner | Schlosser Timothy J | $299,700 | |
| Previous Owner | Carter Phillip E | $204,548 |
Source: Public Records
Tax History Compared to Growth
Tax History
| Year | Tax Paid | Tax Assessment Tax Assessment Total Assessment is a certain percentage of the fair market value that is determined by local assessors to be the total taxable value of land and additions on the property. | Land | Improvement |
|---|---|---|---|---|
| 2025 | $5,481 | $502,210 | $180,277 | $321,933 |
| 2024 | $5,481 | $492,364 | $176,743 | $315,621 |
| 2023 | $5,381 | $482,711 | $173,278 | $309,433 |
| 2022 | $5,300 | $473,247 | $169,881 | $303,366 |
| 2021 | $5,227 | $463,968 | $166,550 | $297,418 |
| 2020 | $5,161 | $459,212 | $164,843 | $294,369 |
| 2019 | $5,110 | $450,209 | $161,611 | $288,598 |
| 2018 | $4,987 | $441,383 | $158,443 | $282,940 |
| 2017 | $4,664 | $432,730 | $155,337 | $277,393 |
| 2016 | $4,731 | $424,246 | $152,292 | $271,954 |
| 2015 | $4,574 | $417,874 | $150,005 | $267,869 |
| 2014 | $4,344 | $409,689 | $147,067 | $262,622 |
Source: Public Records
Map
Nearby Homes
- 106 Rhoades Way
- 124 Windstar Cir
- 148 Big Valley Rd
- 128 Mesquite Ct
- 1118 Buckbrush Dr
- 1173 Boxelder Cir
- 109 Johnston Ct
- 148 Oak Mill Rd
- 1113 Kingfisher Cir
- 242 Briggs Ranch Dr
- 801 Cristina Ct
- 1522 Thurman Way
- 429 N Lexington Dr
- 1553 Bonanza Ln
- 237 Evelyn Way
- 1437 Cummings Way
- 1579 Bonanza Ln
- 108 Bloomfield Way
- 260 Flower Dr
- 1752 Parkway Dr N
- 101 Oneill Ct
- 826 Willow Creek Dr
- 103 Oneill Ct
- 823 Willow Creek Dr
- 821 Willow Creek Dr
- 105 Oneill Ct
- 825 Willow Creek Dr
- 819 Willow Creek Dr
- 100 Oneill Ct
- 827 Willow Creek Dr
- 817 Willow Creek Dr
- 102 Oneill Ct
- 186 Bittercreek Dr
- 184 Bittercreek Dr
- 188 Bittercreek Dr
- 107 Oneill Ct
- 182 Bittercreek Dr
- 815 Willow Creek Dr
- 190 Bittercreek Dr
- 180 Bittercreek Dr