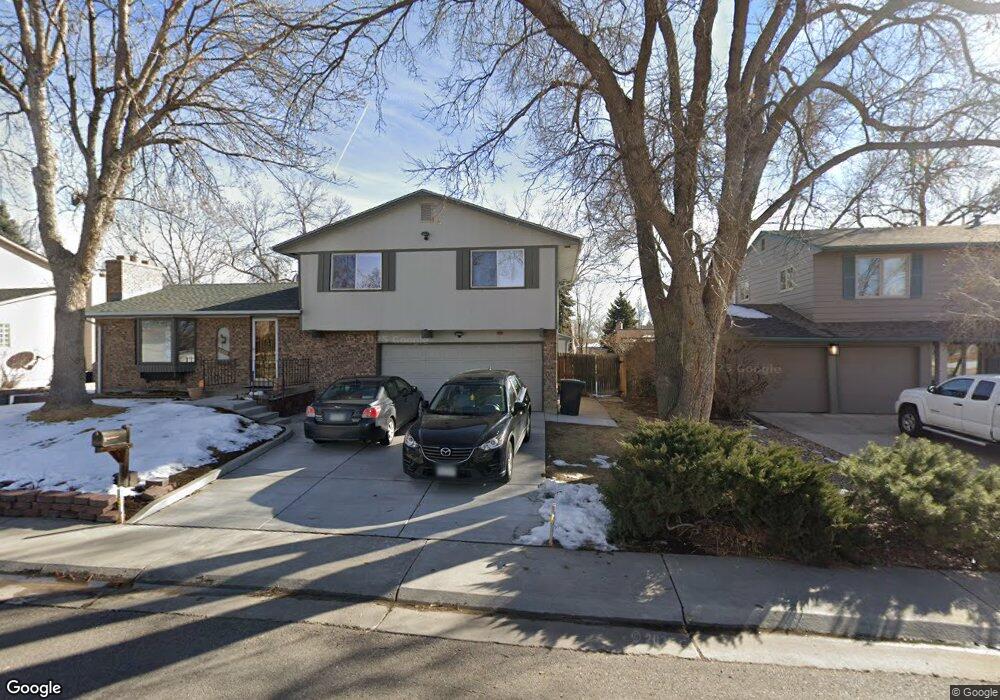
8220 Jay Cir Arvada, CO 80003
Lake Arbor NeighborhoodEstimated Value: $552,825 - $612,000
3
Beds
5
Baths
1,473
Sq Ft
$394/Sq Ft
Est. Value
About This Home
This home is located at 8220 Jay Cir, Arvada, CO 80003 and is currently estimated at $580,206, approximately $393 per square foot. 8220 Jay Cir is a home located in Jefferson County with nearby schools including Little Elementary School, Pomona High School, and Face School.
Ownership History
Date
Name
Owned For
Owner Type
Purchase Details
Closed on
Sep 26, 2017
Sold by
Burnell Carolee W
Bought by
The Carolee Burnell Trust
Current Estimated Value
Purchase Details
Closed on
Oct 14, 2005
Sold by
Burnell Carolee W and Burnell John T
Bought by
Burnell Carolee W
Home Financials for this Owner
Home Financials are based on the most recent Mortgage that was taken out on this home.
Original Mortgage
$198,600
Interest Rate
5.69%
Mortgage Type
New Conventional
Purchase Details
Closed on
Sep 8, 1999
Sold by
Lien Hilmer A and Ettamae Lien
Bought by
Burnell John T and Burnell Carolee W
Home Financials for this Owner
Home Financials are based on the most recent Mortgage that was taken out on this home.
Original Mortgage
$194,201
Interest Rate
7.68%
Mortgage Type
FHA
Create a Home Valuation Report for This Property
The Home Valuation Report is an in-depth analysis detailing your home's value as well as a comparison with similar homes in the area
Home Values in the Area
Average Home Value in this Area
Purchase History
| Date | Buyer | Sale Price | Title Company |
|---|---|---|---|
| The Carolee Burnell Trust | -- | None Available | |
| Burnell Carolee W | -- | Chicago Title Co | |
| Burnell John T | $195,500 | Land Title |
Source: Public Records
Mortgage History
| Date | Status | Borrower | Loan Amount |
|---|---|---|---|
| Previous Owner | Burnell Carolee W | $198,600 | |
| Previous Owner | Burnell John T | $194,201 |
Source: Public Records
Tax History
| Year | Tax Paid | Tax Assessment Tax Assessment Total Assessment is a certain percentage of the fair market value that is determined by local assessors to be the total taxable value of land and additions on the property. | Land | Improvement |
|---|---|---|---|---|
| 2024 | $2,552 | $33,015 | $11,161 | $21,854 |
| 2023 | $2,552 | $33,015 | $11,161 | $21,854 |
| 2022 | $2,756 | $28,140 | $8,035 | $20,105 |
| 2021 | $2,802 | $28,951 | $8,267 | $20,684 |
| 2020 | $2,621 | $27,164 | $7,686 | $19,478 |
| 2019 | $2,586 | $27,164 | $7,686 | $19,478 |
| 2018 | $2,343 | $23,925 | $5,863 | $18,062 |
| 2017 | $2,144 | $23,925 | $5,863 | $18,062 |
| 2016 | $1,955 | $20,546 | $5,422 | $15,124 |
| 2015 | $1,742 | $20,546 | $5,422 | $15,124 |
| 2014 | $1,742 | $17,201 | $5,126 | $12,075 |
Source: Public Records
Map
Nearby Homes
- 6400 W 83rd Place
- 8221 Marshall Ct
- 8136 Gray Ct Unit 509
- 8227 Depew Way
- 8397 Chase Dr
- 6620 W 84th Cir Unit 111
- 6545 W 84th Way Unit 124
- 6545 W 84th Way Unit 127
- 5690 W 80th Place Unit 98
- 5690 W 80th Place Unit 91
- 8414 Kendall Ct
- 5620 W 80th Place Unit 66
- 7958 Harlan St
- 7936 Marshall Cir
- 8250 Chase Way
- 6816 W 84th Cir Unit 38
- 7936 Eaton St
- 6463 W 85th Ave
- 6138 W 85th Place
- 7996 Chase Cir Unit 5
Your Personal Tour Guide
Ask me questions while you tour the home.