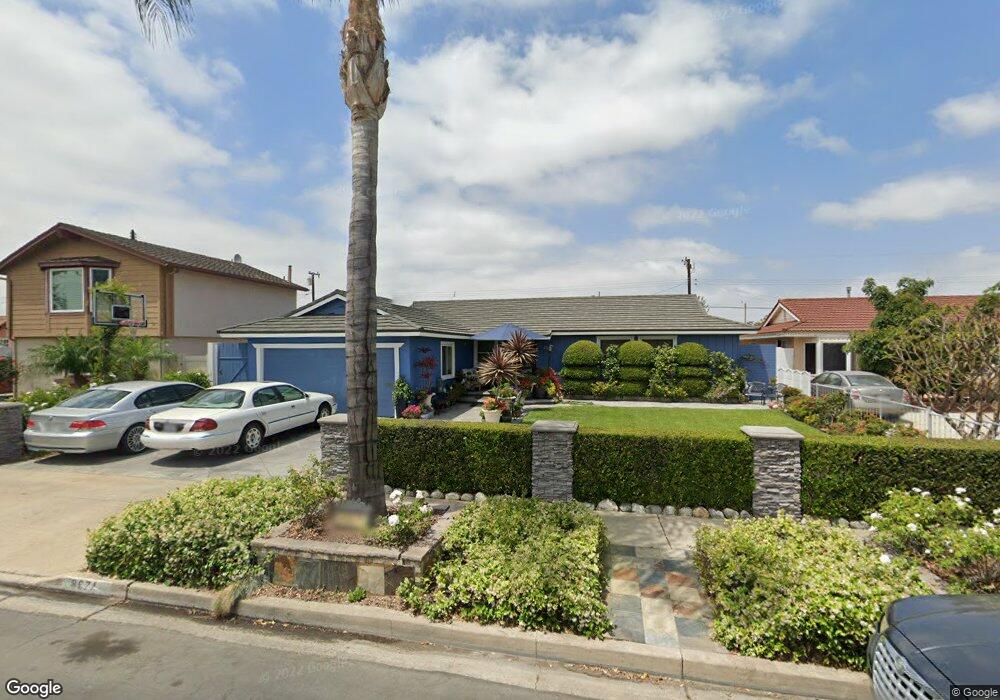
8224 Pepper Cir Buena Park, CA 90620
Estimated Value: $956,704 - $1,075,000
3
Beds
2
Baths
1,802
Sq Ft
$555/Sq Ft
Est. Value
About This Home
This home is located at 8224 Pepper Cir, Buena Park, CA 90620 and is currently estimated at $1,000,676, approximately $555 per square foot. 8224 Pepper Cir is a home located in Orange County with nearby schools including Glen H. Dysinger Sr. Elementary School, Dale Jr High School, and Savanna High School.
Ownership History
Date
Name
Owned For
Owner Type
Purchase Details
Closed on
Dec 9, 2005
Sold by
Truong Quang Minh and Truong Thien My
Bought by
Truong Quang Minh and Truong Thien My
Current Estimated Value
Purchase Details
Closed on
Nov 4, 1998
Sold by
Forg Terry W
Bought by
Truong Quang Minh and Truong Thien My
Home Financials for this Owner
Home Financials are based on the most recent Mortgage that was taken out on this home.
Original Mortgage
$181,200
Outstanding Balance
$40,213
Interest Rate
6.78%
Estimated Equity
$960,463
Purchase Details
Closed on
Aug 19, 1996
Sold by
Forg Terry W
Bought by
Forg Terry William and The Terry William Forg Jr Family Trust
Purchase Details
Closed on
Jan 29, 1996
Sold by
Forg Terry W
Bought by
Forg Terry William
Purchase Details
Closed on
Jan 10, 1995
Sold by
Helton Beverley D
Bought by
Forg Terry W
Home Financials for this Owner
Home Financials are based on the most recent Mortgage that was taken out on this home.
Original Mortgage
$156,600
Interest Rate
9.21%
Create a Home Valuation Report for This Property
The Home Valuation Report is an in-depth analysis detailing your home's value as well as a comparison with similar homes in the area
Home Values in the Area
Average Home Value in this Area
Purchase History
| Date | Buyer | Sale Price | Title Company |
|---|---|---|---|
| Truong Quang Minh | -- | -- | |
| Truong Quang Minh | $226,500 | California Counties Title Co | |
| Forg Terry William | -- | Chicago Title Co | |
| Forg Terry William | -- | Chicago Title Co | |
| Forg Terry William | -- | -- | |
| Forg Terry W | $217,500 | Old Republic Title Co |
Source: Public Records
Mortgage History
| Date | Status | Borrower | Loan Amount |
|---|---|---|---|
| Open | Truong Quang Minh | $181,200 | |
| Previous Owner | Forg Terry W | $156,600 |
Source: Public Records
Tax History Compared to Growth
Tax History
| Year | Tax Paid | Tax Assessment Tax Assessment Total Assessment is a certain percentage of the fair market value that is determined by local assessors to be the total taxable value of land and additions on the property. | Land | Improvement |
|---|---|---|---|---|
| 2025 | $4,167 | $355,075 | $176,169 | $178,906 |
| 2024 | $4,167 | $348,113 | $172,714 | $175,399 |
| 2023 | $4,063 | $341,288 | $169,328 | $171,960 |
| 2022 | $4,009 | $334,597 | $166,008 | $168,589 |
| 2021 | $3,951 | $328,037 | $162,753 | $165,284 |
| 2020 | $3,927 | $324,674 | $161,084 | $163,590 |
| 2019 | $3,830 | $318,308 | $157,925 | $160,383 |
| 2018 | $3,760 | $312,067 | $154,828 | $157,239 |
| 2017 | $3,642 | $305,949 | $151,793 | $154,156 |
| 2016 | $3,573 | $299,950 | $148,816 | $151,134 |
| 2015 | $3,532 | $295,445 | $146,581 | $148,864 |
| 2014 | $3,356 | $289,658 | $143,710 | $145,948 |
Source: Public Records
Map
Nearby Homes
- 2955 W Lincoln Ave Unit 7
- 2871 W Tyler Ave
- 2943 W Lincoln Ave
- 8452 Stanton Ave
- 400 N Syracuse St
- Plan Two at Mason
- Plan Four at Mason
- Plan Three at Mason
- Plan Seven at Mason
- 109 S Laxore St
- 3053 W Coolidge Ave
- 103 S Laxore St
- 106 S Laxore St Unit 407
- 107 S Laxore St
- 7950 Jackson Way
- 8319 Hickory Dr
- 2770 W Lincoln Ave Unit 40
- 2770 W Lincoln Ave Unit 58
- 605 N La Reina St
- 7720 Crescent Ave
- 8218 Pepper Cir
- 8671 Bel Air St
- 8681 Bel Air St
- 8212 Pepper Cir
- 8661 Bel Air St
- 8225 Dracaena Dr
- 8219 Dracaena Dr
- 8241 Dracaena Dr
- 8206 Pepper Cir
- 8213 Dracaena Dr
- 8651 Bel Air St
- 8219 Pepper Cir
- 8701 Bel Air St
- 8213 Pepper Cir
- 8207 Dracaena Dr
- 8200 Pepper Cir
- 8631 Bel Air St
- 8207 Pepper Cir
- 8201 Dracaena Dr