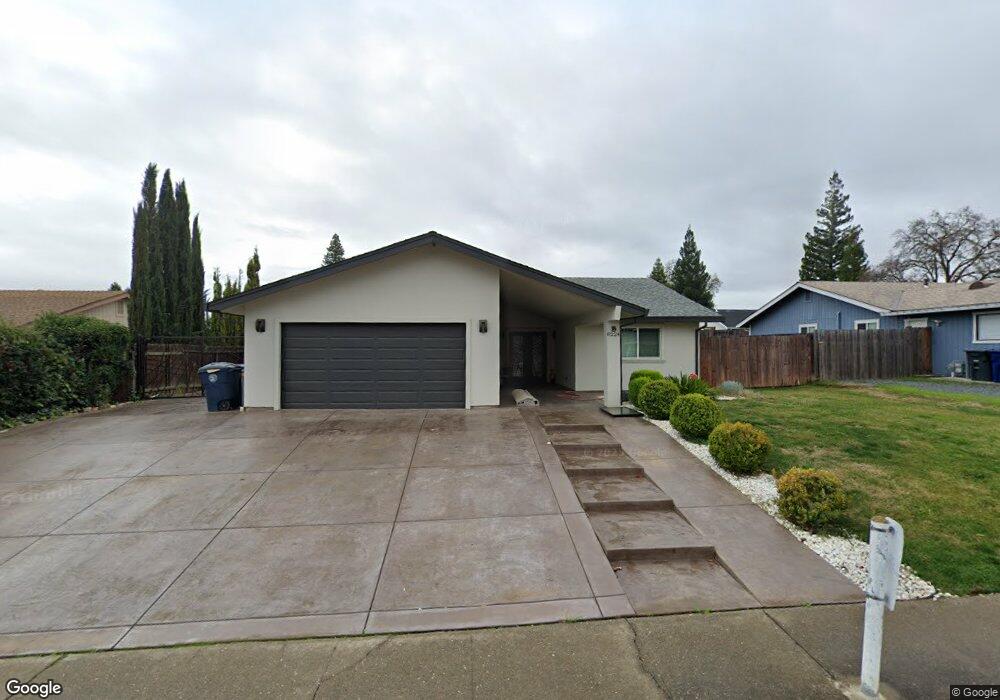
8224 Prime Way Citrus Heights, CA 95610
Estimated Value: $511,000 - $544,599
3
Beds
2
Baths
1,536
Sq Ft
$344/Sq Ft
Est. Value
About This Home
This home is located at 8224 Prime Way, Citrus Heights, CA 95610 and is currently estimated at $527,650, approximately $343 per square foot. 8224 Prime Way is a home located in Sacramento County with nearby schools including Oakview Community Elementary School, Louis Pasteur Fundamental Middle School, and Casa Roble Fundamental High School.
Ownership History
Date
Name
Owned For
Owner Type
Purchase Details
Closed on
May 18, 2021
Sold by
Outsourced Legal Support Llc
Bought by
Melkonyan Roman and Danielyan Seda
Current Estimated Value
Purchase Details
Closed on
Nov 11, 2014
Sold by
Bronder Edward Ronald and Delzer Patti Lee
Bought by
Outsourced Legal Support Llc
Home Financials for this Owner
Home Financials are based on the most recent Mortgage that was taken out on this home.
Original Mortgage
$220,000
Interest Rate
4.16%
Mortgage Type
Seller Take Back
Purchase Details
Closed on
Aug 28, 2014
Sold by
Bronder Edward R and Delzer Patti L
Bought by
Bronder Edward Ronald and Delzer Patti Lee
Purchase Details
Closed on
Mar 15, 2004
Sold by
Delzer Patti L
Bought by
Delzer Patti L and Patti L Delzer Family Trust
Create a Home Valuation Report for This Property
The Home Valuation Report is an in-depth analysis detailing your home's value as well as a comparison with similar homes in the area
Home Values in the Area
Average Home Value in this Area
Purchase History
| Date | Buyer | Sale Price | Title Company |
|---|---|---|---|
| Melkonyan Roman | $220,000 | None Available | |
| Outsourced Legal Support Llc | $220,000 | Chicago Title Company | |
| Bronder Edward Ronald | -- | None Available | |
| Delzer Patti L | -- | None Available | |
| Delzer Patti L | -- | -- |
Source: Public Records
Mortgage History
| Date | Status | Borrower | Loan Amount |
|---|---|---|---|
| Previous Owner | Outsourced Legal Support Llc | $220,000 |
Source: Public Records
Tax History Compared to Growth
Tax History
| Year | Tax Paid | Tax Assessment Tax Assessment Total Assessment is a certain percentage of the fair market value that is determined by local assessors to be the total taxable value of land and additions on the property. | Land | Improvement |
|---|---|---|---|---|
| 2025 | $5,546 | $476,268 | $108,242 | $368,026 |
| 2024 | $5,546 | $466,930 | $106,120 | $360,810 |
| 2023 | $5,404 | $457,776 | $104,040 | $353,736 |
| 2022 | $5,374 | $448,800 | $102,000 | $346,800 |
| 2021 | $2,993 | $244,264 | $77,719 | $166,545 |
| 2020 | $2,938 | $241,761 | $76,923 | $164,838 |
| 2019 | $2,879 | $237,021 | $75,415 | $161,606 |
| 2018 | $2,846 | $232,375 | $73,937 | $158,438 |
| 2017 | $2,818 | $227,820 | $72,488 | $155,332 |
| 2016 | $2,634 | $223,354 | $71,067 | $152,287 |
| 2015 | $2,589 | $220,000 | $70,000 | $150,000 |
| 2014 | $1,556 | $131,390 | $39,056 | $92,334 |
Source: Public Records
Map
Nearby Homes
- 7260 Mandarin Cir
- 8122 Stacey Hills Dr
- 6813 Mellodora Dr
- 8052 Cammeray Dr
- 8205 Lash Larue Ln
- 8311 Juglans Dr
- 8047 Mcclung Dr
- 7517 Quail Vista Ln
- 8075 Alma Mesa Way
- 8429 Menke Way
- 8078 Oak Meadow Ct
- 8021 Dana Butte Way
- 7616 Wooddale Way
- 7080 Canelo Hills Dr
- 6929 Lyonia Way
- 8033 Larwin Dr
- 7156 Woodmore Oaks Dr
- 8609 Briarbrook Cir
- 7412 Fox Hills Dr
- 7720 Claypool Way
- 8220 Prime Way
- 8229 Oakenshaw Way
- 8225 Oakenshaw Way
- 8216 Prime Way
- 8233 Oakenshaw Way
- 8232 Prime Way
- 8221 Oakenshaw Way
- 8237 Oakenshaw Way
- 8225 Prime Way
- 8221 Prime Way
- 8229 Prime Way
- 8212 Prime Way
- 8236 Prime Way
- 8217 Oakenshaw Way
- 8241 Oakenshaw Way
- 8217 Prime Way
- 8233 Prime Way
- 8228 Oakenshaw Way
- 8224 Oakenshaw Way
- 8232 Oakenshaw Way