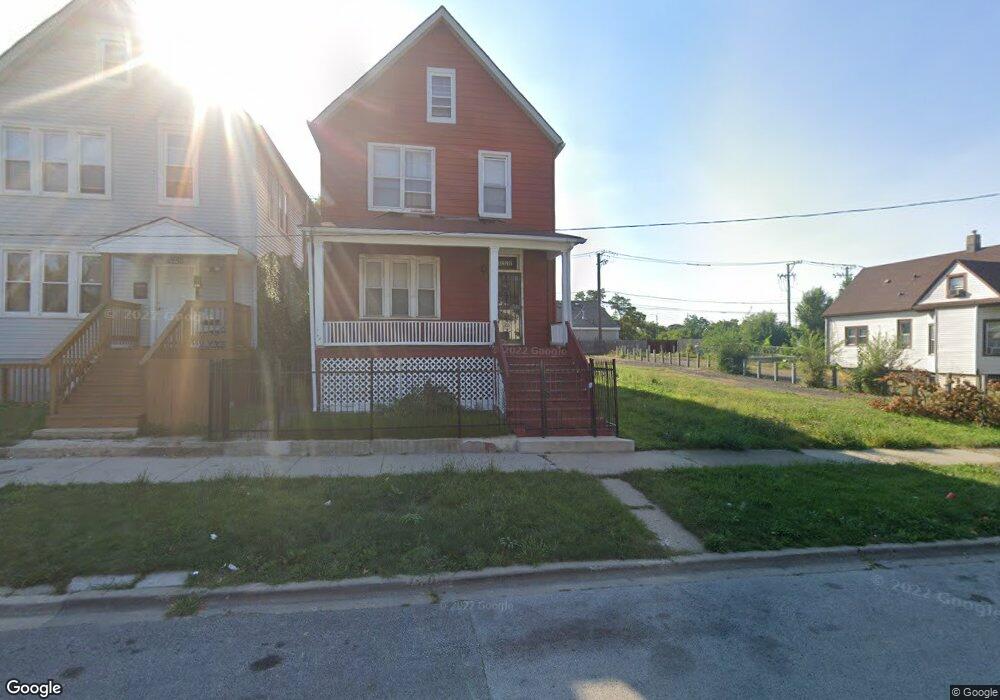
8224 S Emerald Ave Chicago, IL 60620
Auburn Gresham NeighborhoodEstimated Value: $235,000 - $306,848
6
Beds
2
Baths
3,178
Sq Ft
$85/Sq Ft
Est. Value
About This Home
This home is located at 8224 S Emerald Ave, Chicago, IL 60620 and is currently estimated at $270,924, approximately $85 per square foot. 8224 S Emerald Ave is a home located in Cook County with nearby schools including Westcott Elementary School, Emil G. Hirsch Metropolitan High School, and Community Youth Development Institute.
Ownership History
Date
Name
Owned For
Owner Type
Purchase Details
Closed on
Dec 22, 2017
Sold by
Kovacevich Nicholas
Bought by
Qcd Financial Llc
Current Estimated Value
Purchase Details
Closed on
Oct 16, 2014
Sold by
Fannie Mae
Bought by
Kovacevich Nicholas
Purchase Details
Closed on
Mar 7, 2014
Sold by
Mims Trasha D
Bought by
Federal National Mortgage Association
Purchase Details
Closed on
Dec 30, 2003
Sold by
Hff Corp Inc
Bought by
First American Bank and Trust #1-03-124
Home Financials for this Owner
Home Financials are based on the most recent Mortgage that was taken out on this home.
Original Mortgage
$160,800
Interest Rate
6.08%
Mortgage Type
Commercial
Purchase Details
Closed on
Aug 2, 2003
Sold by
Bank Of New York
Bought by
Hff Corp Inc
Purchase Details
Closed on
Aug 2, 2002
Sold by
Greer Patricia
Bought by
The Bank Of New York
Create a Home Valuation Report for This Property
The Home Valuation Report is an in-depth analysis detailing your home's value as well as a comparison with similar homes in the area
Home Values in the Area
Average Home Value in this Area
Purchase History
| Date | Buyer | Sale Price | Title Company |
|---|---|---|---|
| Qcd Financial Llc | -- | Fidelity National Title | |
| Kovacevich Nicholas | -- | Premier Title | |
| Federal National Mortgage Association | -- | None Available | |
| First American Bank | $201,000 | First American | |
| Hff Corp Inc | $67,000 | Metropolitan Title Co | |
| The Bank Of New York | -- | -- |
Source: Public Records
Mortgage History
| Date | Status | Borrower | Loan Amount |
|---|---|---|---|
| Previous Owner | First American Bank | $160,800 | |
| Closed | First American Bank | $30,150 |
Source: Public Records
Tax History Compared to Growth
Tax History
| Year | Tax Paid | Tax Assessment Tax Assessment Total Assessment is a certain percentage of the fair market value that is determined by local assessors to be the total taxable value of land and additions on the property. | Land | Improvement |
|---|---|---|---|---|
| 2024 | $558 | $1,763 | $1,763 | -- |
| 2023 | $544 | $2,644 | $2,644 | -- |
| 2022 | $544 | $2,644 | $2,644 | $0 |
| 2021 | $531 | $2,643 | $2,643 | $0 |
| 2020 | $589 | $2,643 | $2,643 | $0 |
| 2019 | $531 | $2,643 | $2,643 | $0 |
| 2018 | $522 | $2,643 | $2,643 | $0 |
| 2017 | $493 | $2,291 | $2,291 | $0 |
| 2016 | $817 | $4,080 | $2,291 | $1,789 |
| 2015 | $2,059 | $11,235 | $2,291 | $8,944 |
| 2014 | $2,122 | $11,438 | $2,115 | $9,323 |
| 2013 | $2,080 | $11,438 | $2,115 | $9,323 |
Source: Public Records
Map
Nearby Homes
- 8144 S Green St
- 8350 S Green St
- 8318 S Peoria St
- 8125 S Peoria St
- 8153 S Sangamon St
- 652 W 81st St
- 8211 S Morgan St
- 8307 S Morgan St
- 8009 S Halsted St
- 8027 S Green St
- 8358 S Sangamon St
- 8440 S Peoria St
- 7603 S Lowe Ave
- 8254 S Morgan St
- 8414 S Sangamon St
- 8109 S Morgan St
- 8037 S Sangamon St
- 8022 S Peoria St
- 643 W 80th St
- 639 W 80th St
- 8224 S Emerald Ave
- 8228 S Emerald Ave
- 8230 S Emerald Ave
- 8230 S Emerald Ave
- 8230 S Emerald Ave Unit 2
- 8234 S Emerald Ave
- 8216 S Emerald Ave
- 8240 S Emerald Ave
- 8213 S Emerald Ave
- 8242 S Emerald Ave
- 8242 S Emerald Ave
- 8229 S Emerald Ave
- 8223 S Emerald Ave
- 8223 S Emerald Ave
- 8206 S Emerald Ave
- 8206 S Emerald Ave
- 8225 S Emerald Ave
- 8235 S Halsted St Unit 1
- 8235 S Halsted St
- 8231 S Emerald Ave