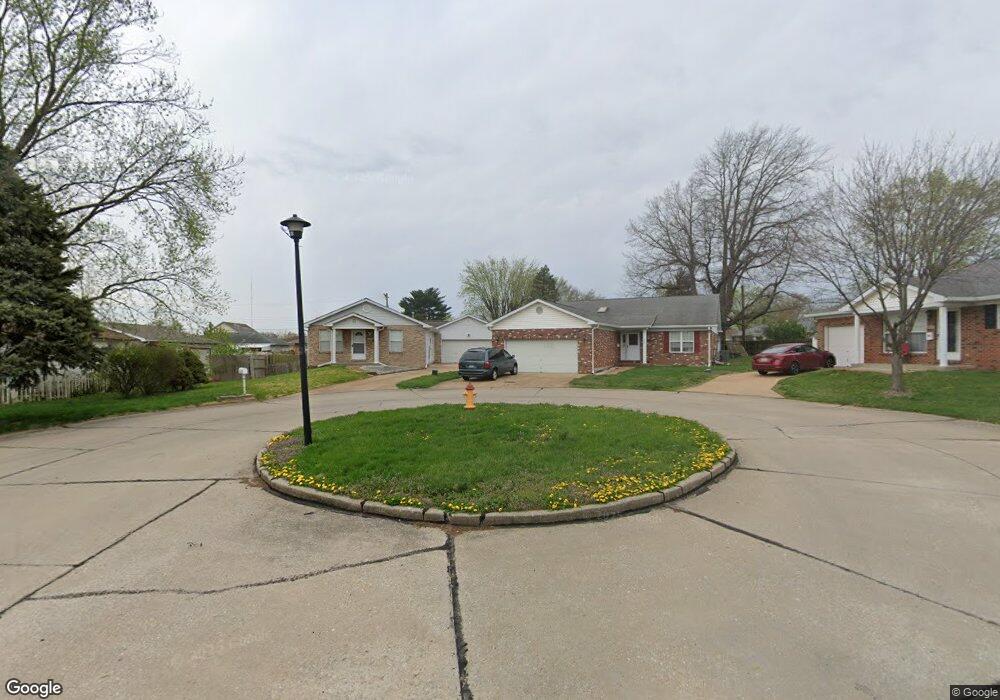
8228 Mastis Meadows Ct Saint Louis, MO 63123
Lemay NeighborhoodEstimated Value: $224,000 - $254,852
3
Beds
2
Baths
1,134
Sq Ft
$209/Sq Ft
Est. Value
About This Home
This home is located at 8228 Mastis Meadows Ct, Saint Louis, MO 63123 and is currently estimated at $236,963, approximately $208 per square foot. 8228 Mastis Meadows Ct is a home located in St. Louis County with nearby schools including Bayless Elementary School, Bayless Junior High School, and Bayless Senior High School.
Ownership History
Date
Name
Owned For
Owner Type
Purchase Details
Closed on
Jan 29, 1999
Sold by
Tang Soi Nhat and Hong Christy
Bought by
Tang Soi Nhat and Hong Christy
Current Estimated Value
Home Financials for this Owner
Home Financials are based on the most recent Mortgage that was taken out on this home.
Original Mortgage
$83,363
Interest Rate
6.43%
Mortgage Type
FHA
Purchase Details
Closed on
Dec 29, 1997
Sold by
Quillen Dolores J
Bought by
Tang Soi Nhat and Hong Christy
Home Financials for this Owner
Home Financials are based on the most recent Mortgage that was taken out on this home.
Original Mortgage
$83,282
Interest Rate
7.15%
Mortgage Type
FHA
Purchase Details
Closed on
Sep 18, 1997
Sold by
Gravagna Angelo A and Gravagna Marie T
Bought by
Dolores J Quillen Revocable Living Trust
Create a Home Valuation Report for This Property
The Home Valuation Report is an in-depth analysis detailing your home's value as well as a comparison with similar homes in the area
Home Values in the Area
Average Home Value in this Area
Purchase History
| Date | Buyer | Sale Price | Title Company |
|---|---|---|---|
| Tang Soi Nhat | -- | -- | |
| Tang Soi Nhat | -- | -- | |
| Dolores J Quillen Revocable Living Trust | -- | -- |
Source: Public Records
Mortgage History
| Date | Status | Borrower | Loan Amount |
|---|---|---|---|
| Closed | Tang Soi Nhat | $83,363 | |
| Closed | Tang Soi Nhat | $83,282 |
Source: Public Records
Tax History Compared to Growth
Tax History
| Year | Tax Paid | Tax Assessment Tax Assessment Total Assessment is a certain percentage of the fair market value that is determined by local assessors to be the total taxable value of land and additions on the property. | Land | Improvement |
|---|---|---|---|---|
| 2025 | $2,552 | $41,650 | $13,950 | $27,700 |
| 2024 | $2,552 | $35,340 | $6,970 | $28,370 |
| 2023 | $2,512 | $35,340 | $6,970 | $28,370 |
| 2022 | $2,510 | $31,920 | $7,750 | $24,170 |
| 2021 | $2,446 | $31,920 | $7,750 | $24,170 |
| 2020 | $2,202 | $26,600 | $7,680 | $18,920 |
| 2019 | $425 | $26,600 | $7,680 | $18,920 |
| 2018 | $2,362 | $25,390 | $6,710 | $18,680 |
| 2017 | $2,218 | $25,390 | $6,710 | $18,680 |
| 2016 | $1,958 | $22,010 | $3,480 | $18,530 |
| 2015 | $3,537 | $22,010 | $3,480 | $18,530 |
| 2014 | $3,705 | $23,860 | $6,060 | $17,800 |
Source: Public Records
Map
Nearby Homes
- 4338 Seibert Ave
- 4606 Heege Rd
- 4530 Grasso Ave
- 8706 Fatima Dr
- 4700 Stone Ave
- 4409 Fatima Dr
- 4704 Stone Ave
- 4739 Heege Rd
- 8911 Kammerer Ave
- 4760 Stone Ave
- 4248 Kay Ln Unit 9
- 8120 Parkridge Dr
- 4415 Cayuga Dr
- 4758 Heidelberg Ave
- 8015 Carlsbad Dr
- 4023 Healy Ct
- 9038 Kickapoo Dr
- 4834 Heidelberg Ave
- 4825 Oldenburg Ave
- 4955 Seibert Ave
- 8229 Mastis Meadows Ct
- 8221 Pear Ln
- 8217 Pear Ln
- 4315 Sinnwell Dr
- 4323 Sinnwell Dr
- 8215 Pear Ln
- 4311 Sinnwell Dr
- 8221 Mastis Meadows Ct
- 8232 Henze Ct
- 4327 Sinnwell Dr
- 8213 Pear Ln
- 4307 Sinnwell Dr
- 8226 Henze Ct
- 8217 Mastis Meadows Ct
- 8236 Henze Ct
- 8222 Henze Ct
- 601 Union Rd
- 8209 Pear Ln
- 8213 Mastis Meadows Ct
- 8519 Morganford 8523