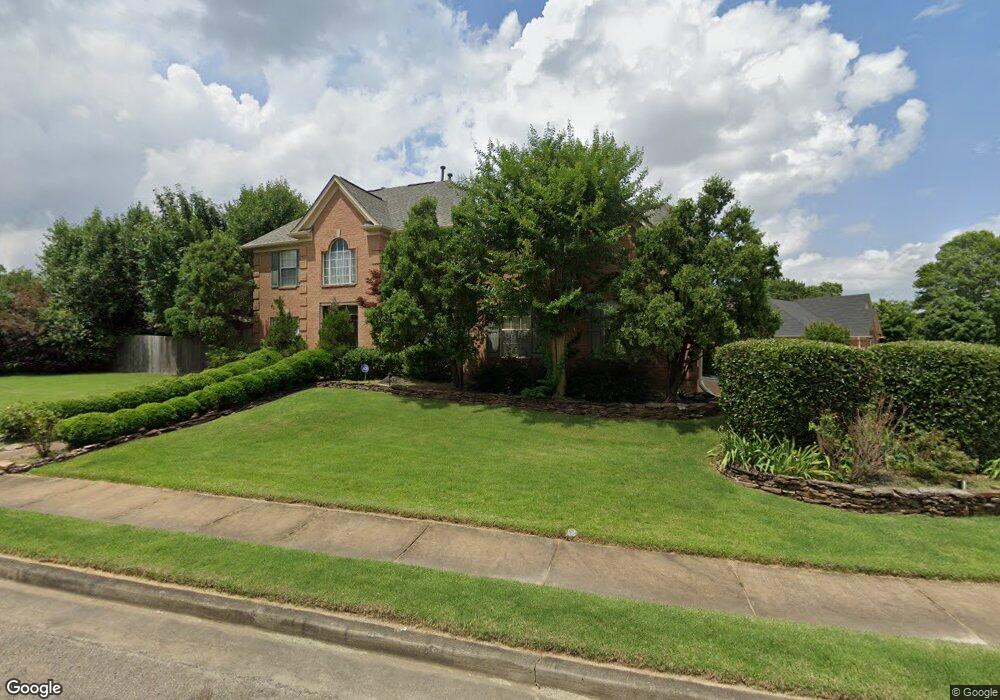
8229 Floral Spring Dr Cordova, TN 38016
Cordova NeighborhoodEstimated Value: $307,000 - $353,000
3
Beds
4
Baths
3,008
Sq Ft
$109/Sq Ft
Est. Value
About This Home
This home is located at 8229 Floral Spring Dr, Cordova, TN 38016 and is currently estimated at $327,082, approximately $108 per square foot. 8229 Floral Spring Dr is a home located in Shelby County with nearby schools including Riverwood Elementary School, Cordova Middle School, and Cordova High School.
Ownership History
Date
Name
Owned For
Owner Type
Purchase Details
Closed on
Mar 11, 2008
Sold by
Dill Walter R and Dill Marilyn J
Bought by
Mondragon Nancelila
Current Estimated Value
Home Financials for this Owner
Home Financials are based on the most recent Mortgage that was taken out on this home.
Original Mortgage
$161,405
Outstanding Balance
$99,904
Interest Rate
5.62%
Mortgage Type
Purchase Money Mortgage
Estimated Equity
$227,178
Purchase Details
Closed on
Jul 31, 2000
Sold by
Riddle Sidney Richard and Riddle Lavonna Lee
Bought by
Dill Walter R and Dill Marilyn J
Home Financials for this Owner
Home Financials are based on the most recent Mortgage that was taken out on this home.
Original Mortgage
$182,900
Interest Rate
8.12%
Mortgage Type
VA
Purchase Details
Closed on
Jun 17, 1999
Sold by
Highland Building Group Llc
Bought by
Riddle Sidney Richard
Home Financials for this Owner
Home Financials are based on the most recent Mortgage that was taken out on this home.
Original Mortgage
$173,755
Interest Rate
7.04%
Create a Home Valuation Report for This Property
The Home Valuation Report is an in-depth analysis detailing your home's value as well as a comparison with similar homes in the area
Home Values in the Area
Average Home Value in this Area
Purchase History
| Date | Buyer | Sale Price | Title Company |
|---|---|---|---|
| Mondragon Nancelila | $169,900 | Realty Title | |
| Dill Walter R | $182,900 | Memphis Title | |
| Riddle Sidney Richard | $182,900 | -- |
Source: Public Records
Mortgage History
| Date | Status | Borrower | Loan Amount |
|---|---|---|---|
| Open | Mondragon Nancelila | $161,405 | |
| Previous Owner | Dill Walter R | $182,900 | |
| Previous Owner | Riddle Sidney Richard | $173,755 |
Source: Public Records
Tax History Compared to Growth
Tax History
| Year | Tax Paid | Tax Assessment Tax Assessment Total Assessment is a certain percentage of the fair market value that is determined by local assessors to be the total taxable value of land and additions on the property. | Land | Improvement |
|---|---|---|---|---|
| 2025 | $1,886 | $87,275 | $14,250 | $73,025 |
| 2024 | $1,886 | $55,625 | $9,250 | $46,375 |
| 2023 | $3,388 | $55,625 | $9,250 | $46,375 |
| 2022 | $3,388 | $55,625 | $9,250 | $46,375 |
| 2021 | $3,428 | $55,625 | $9,250 | $46,375 |
| 2020 | $2,900 | $40,025 | $9,250 | $30,775 |
| 2019 | $2,900 | $40,025 | $9,250 | $30,775 |
| 2018 | $2,900 | $40,025 | $9,250 | $30,775 |
| 2017 | $1,645 | $40,025 | $9,250 | $30,775 |
| 2016 | $1,478 | $33,825 | $0 | $0 |
| 2014 | $1,478 | $33,825 | $0 | $0 |
Source: Public Records
Map
Nearby Homes
- 1235 Creeks Edge Cove
- 1235 Dexter Ln
- 8495 Farley Ave
- 8271 Shallow Rock Cove
- 8277 Glen Rock Cove
- 8545 Woodland Rose Cir S
- 8130 Shallow Glen Trail
- 8544 Woodland Rose Cir S
- 970 Cully Rd
- 984 Nesting Wood Cir E
- 7999 Club Center Dr
- 1206 Chapel Park Blvd
- 8453 Thor Rd
- 8349 Honey Dew Cove
- 1201 Allentown St
- 2288 Germantown Dr
- 1595 Beaver Trail Ln
- 970 Bending Pine Ln
- 7952 Meadow Trail Dr
- 901 Timber Grove Dr
- 8272 Garden Willow Ln
- 8241 Floral Spring Dr
- 8264 Garden Willow Ln
- 8269 Garden Willow Ln
- 8278 Garden Willow Ln
- 8263 Garden Willow Ln
- 8234 Floral Spring Dr
- 8238 Floral Spring Dr
- 8230 Floral Spring Dr
- 8279 Garden Willow Ln
- 8265 Floral Spring Dr
- 8242 Floral Spring Dr
- 8260 Garden Willow Ln
- 8284 Garden Willow Ln
- 8259 Garden Willow Ln
- 8246 Floral Spring Dr
- 8250 Hampton Wood Cove
- 8271 Floral Spring Dr
- 8262 Floral Spring Dr
- 1233 Thornton Cove