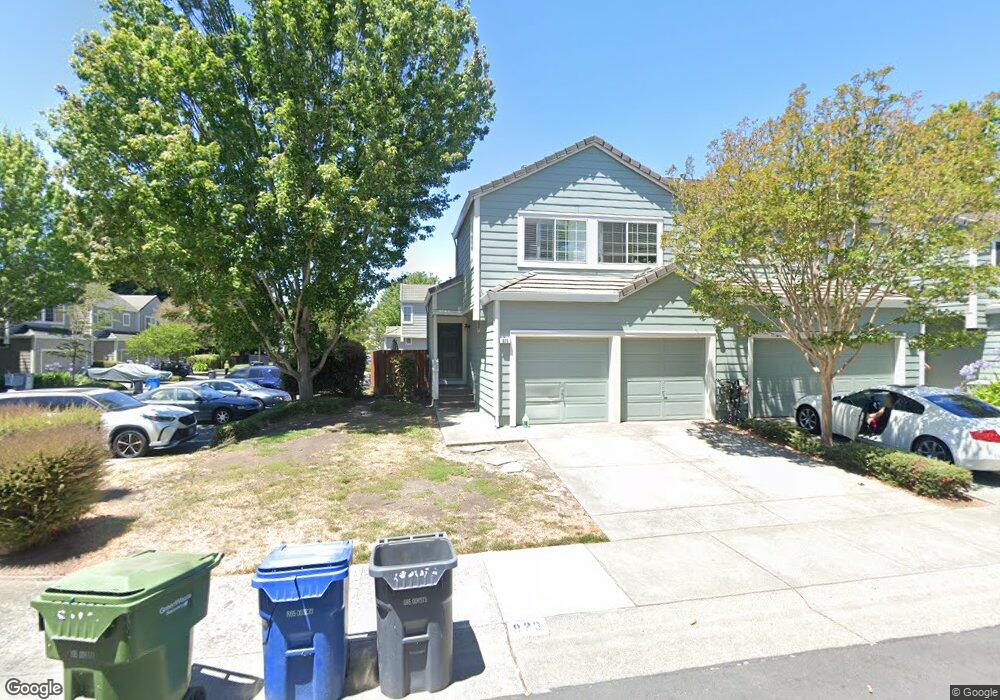
823 Chardonnay Cir Petaluma, CA 94954
College Heights NeighborhoodEstimated Value: $659,968 - $798,000
3
Beds
3
Baths
1,333
Sq Ft
$527/Sq Ft
Est. Value
About This Home
This home is located at 823 Chardonnay Cir, Petaluma, CA 94954 and is currently estimated at $702,742, approximately $527 per square foot. 823 Chardonnay Cir is a home located in Sonoma County with nearby schools including Meadow Elementary School, Kenilworth Junior High School, and Casa Grande High School.
Ownership History
Date
Name
Owned For
Owner Type
Purchase Details
Closed on
Jun 27, 2017
Sold by
Coleman Fannie M
Bought by
The Fannie M Coleman 2017 Trust
Current Estimated Value
Purchase Details
Closed on
Jan 14, 1999
Sold by
Coleman Jessie
Bought by
Coleman Jessie and Coleman Fannie M
Home Financials for this Owner
Home Financials are based on the most recent Mortgage that was taken out on this home.
Original Mortgage
$165,500
Outstanding Balance
$37,957
Interest Rate
6.63%
Estimated Equity
$664,785
Purchase Details
Closed on
Sep 22, 1994
Sold by
Oceanis
Bought by
Coleman Jessie and Coleman Fannie M
Home Financials for this Owner
Home Financials are based on the most recent Mortgage that was taken out on this home.
Original Mortgage
$160,050
Interest Rate
4.87%
Create a Home Valuation Report for This Property
The Home Valuation Report is an in-depth analysis detailing your home's value as well as a comparison with similar homes in the area
Home Values in the Area
Average Home Value in this Area
Purchase History
| Date | Buyer | Sale Price | Title Company |
|---|---|---|---|
| The Fannie M Coleman 2017 Trust | -- | None Available | |
| Coleman Jessie | -- | Chicago Title Co | |
| Coleman Jessie | $168,500 | North Bay Title Co |
Source: Public Records
Mortgage History
| Date | Status | Borrower | Loan Amount |
|---|---|---|---|
| Open | Coleman Jessie | $165,500 | |
| Previous Owner | Coleman Jessie | $160,050 |
Source: Public Records
Tax History Compared to Growth
Tax History
| Year | Tax Paid | Tax Assessment Tax Assessment Total Assessment is a certain percentage of the fair market value that is determined by local assessors to be the total taxable value of land and additions on the property. | Land | Improvement |
|---|---|---|---|---|
| 2025 | $3,266 | $283,413 | $117,735 | $165,678 |
| 2024 | $3,266 | $277,857 | $115,427 | $162,430 |
| 2023 | $3,266 | $272,410 | $113,164 | $159,246 |
| 2022 | $3,214 | $267,070 | $110,946 | $156,124 |
| 2021 | $3,148 | $261,834 | $108,771 | $153,063 |
| 2020 | $3,167 | $259,150 | $107,656 | $151,494 |
| 2019 | $3,088 | $254,070 | $105,546 | $148,524 |
| 2018 | $3,115 | $249,089 | $103,477 | $145,612 |
| 2017 | $3,068 | $244,206 | $101,449 | $142,757 |
| 2016 | $2,977 | $239,418 | $99,460 | $139,958 |
| 2015 | $2,964 | $235,823 | $97,967 | $137,856 |
| 2014 | $2,940 | $231,204 | $96,048 | $135,156 |
Source: Public Records
Map
Nearby Homes
- 837 Vineyard Place
- 1757 Burgundy Ct
- 1845 Sandstone Dr
- 1971 Lansdowne Way
- 1548 Royal Oak Dr
- 1544 Crown Rd
- 1441 Woodside Cir
- 97 Candlewood Dr
- 1501 Florence Way
- 829 Winton Dr
- 1407 Woodside Cir
- 116 Marvin Ct
- 529 Rosewood Cir
- 71 Candlewood Dr
- 63 Oakwood Dr
- 628 Nikki Dr
- 523 Greenwich St
- 20 E Napa Dr
- 20 Oakwood Dr
- 717 N Mcdowell Blvd Unit 111
- 825 Chardonnay Cir
- 827 Chardonnay Cir
- 1702 Gamay Place
- 829 Chardonnay Cir
- 1704 Gamay Place
- 843 Chardonnay Cir
- 817 Chardonnay Cir
- 845 Chardonnay Cir
- 1706 Gamay Place
- 1701 Gamay Place
- 815 Chardonnay Cir
- 824 Chardonnay Cir
- 847 Chardonnay Cir
- 1703 Gamay Place
- 822 Chardonnay Cir
- 820 Chardonnay Cir
- 826 Chardonnay Cir
- 1705 Gamay Place
- 813 Chardonnay Cir
- 818 Chardonnay Cir