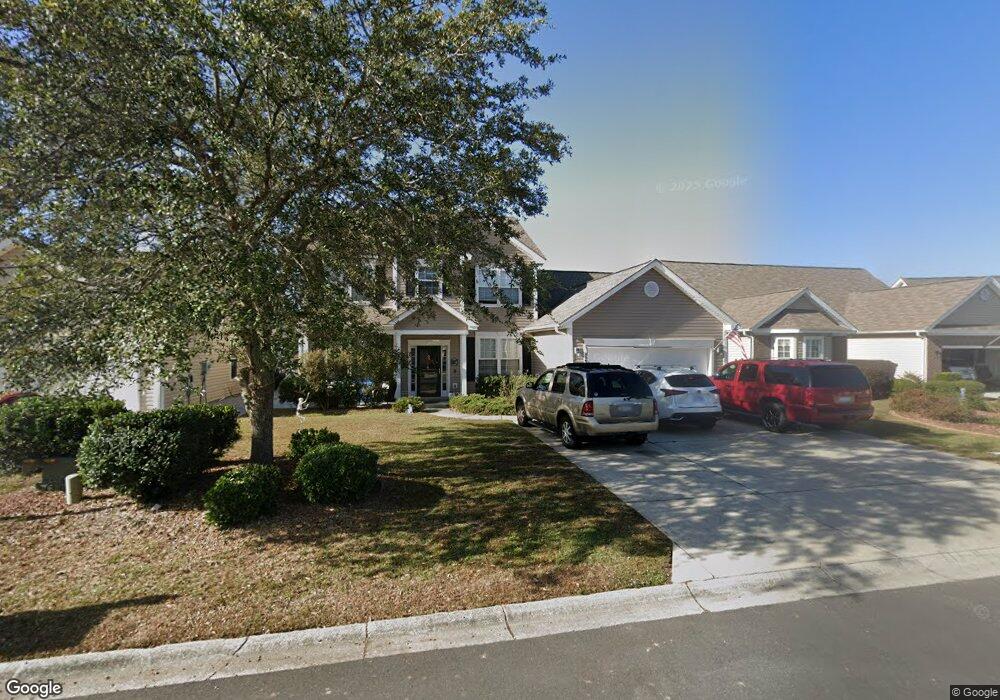
823 Clarion Ct Myrtle Beach, SC 29588
Estimated Value: $373,000 - $404,000
4
Beds
3
Baths
2,499
Sq Ft
$154/Sq Ft
Est. Value
About This Home
This home is located at 823 Clarion Ct, Myrtle Beach, SC 29588 and is currently estimated at $384,360, approximately $153 per square foot. 823 Clarion Ct is a home located in Horry County with nearby schools including Burgess Elementary School, St. James Middle School, and St. James Intermediate.
Ownership History
Date
Name
Owned For
Owner Type
Purchase Details
Closed on
Oct 27, 2016
Sold by
Meyer Steven R
Bought by
Crenades Thomas M and Crenades Susana C
Current Estimated Value
Home Financials for this Owner
Home Financials are based on the most recent Mortgage that was taken out on this home.
Original Mortgage
$220,400
Outstanding Balance
$175,990
Interest Rate
3.42%
Mortgage Type
New Conventional
Estimated Equity
$208,370
Purchase Details
Closed on
Sep 5, 2012
Sold by
Mimnaugh Michael Conor
Bought by
Wright Jessica L
Purchase Details
Closed on
Mar 31, 2010
Sold by
Zimmerman Shawn K
Bought by
Mimnaugh Michael Conor
Purchase Details
Closed on
Nov 16, 2005
Sold by
Beazer Homes Corp
Bought by
Zimmerman Shawn K
Home Financials for this Owner
Home Financials are based on the most recent Mortgage that was taken out on this home.
Original Mortgage
$194,800
Interest Rate
6.04%
Mortgage Type
Fannie Mae Freddie Mac
Purchase Details
Closed on
Jun 29, 2005
Sold by
Brynfield Development Llc
Bought by
Beazer Homes Corp
Create a Home Valuation Report for This Property
The Home Valuation Report is an in-depth analysis detailing your home's value as well as a comparison with similar homes in the area
Home Values in the Area
Average Home Value in this Area
Purchase History
| Date | Buyer | Sale Price | Title Company |
|---|---|---|---|
| Crenades Thomas M | $232,000 | -- | |
| Wright Jessica L | $189,000 | -- | |
| Mimnaugh Michael Conor | $207,000 | -- | |
| Zimmerman Shawn K | $213,221 | -- | |
| Beazer Homes Corp | $244,300 | -- |
Source: Public Records
Mortgage History
| Date | Status | Borrower | Loan Amount |
|---|---|---|---|
| Open | Crenades Thomas M | $220,400 | |
| Previous Owner | Zimmerman Shawn K | $194,800 |
Source: Public Records
Tax History Compared to Growth
Tax History
| Year | Tax Paid | Tax Assessment Tax Assessment Total Assessment is a certain percentage of the fair market value that is determined by local assessors to be the total taxable value of land and additions on the property. | Land | Improvement |
|---|---|---|---|---|
| 2024 | $1,164 | $16,103 | $3,680 | $12,423 |
| 2023 | $1,164 | $15,248 | $2,264 | $12,984 |
| 2021 | $3,333 | $10,166 | $1,510 | $8,656 |
| 2020 | $3,172 | $10,166 | $1,510 | $8,656 |
| 2019 | $3,172 | $15,248 | $2,264 | $12,984 |
| 2018 | $0 | $13,620 | $2,130 | $11,490 |
| 2017 | $2,926 | $13,620 | $2,130 | $11,490 |
| 2016 | -- | $12,420 | $2,130 | $10,290 |
| 2015 | $718 | $11,292 | $1,830 | $9,462 |
| 2014 | $663 | $11,292 | $1,830 | $9,462 |
Source: Public Records
Map
Nearby Homes
- 418 Hardwood Dr Unit 14
- 203 Buckwood Dr Unit 17
- 215 Buckwood Dr Unit 20
- 219 Buckwood Dr Unit 21
- 851 Indian Wood Ln
- 7420 Springside Dr
- 249 Cabo Loop
- 333 Ashwood Ln Unit MB
- 3990 Lochview Dr
- 357 Cabo Loop
- 4096 Grousewood Dr
- 3910 Stillwood Dr
- 5580 Green Bay Cir
- 3888 Stillwood Dr
- 205 Black Pearl Way
- 3886 Stillwood Dr
- 422 Hardwood Dr Unit 13
- 211 Buckwood Dr Unit 19
- 207 Buckwood Dr Unit 18
- 414 Hardwood Dr Unit 15
- 823 Clarion Ct Unit Brynfield
- 823 Clarion Ct Unit BRYNFIELD PARK
- 823 Clark Blvd Unit Brynfield
- 823 Clark Blvd Unit BRYNFIELD PARK
- 823 Clark Blvd
- 819 Clarion Ct
- 827 Clarion Ct
- 801 Clark Blvd
- 801 Clark Blvd Unit Brynfield Park
- 815 Clarion Ct
- 831 Clarion Ct
- 812 Clarion Ct
- 811 Clarion Ct
- 816 Clarion Ct
- 528 Saddlebrook Ct
- 835 Clark Blvd
- 521 Saddlebrook Ct
- 527 Saddlebrook Ct Unit Brynfield Park
- 527 Saddlebrook Ct Unit Brynfield Park Lot 1
- 527 Saddlebrook Ct