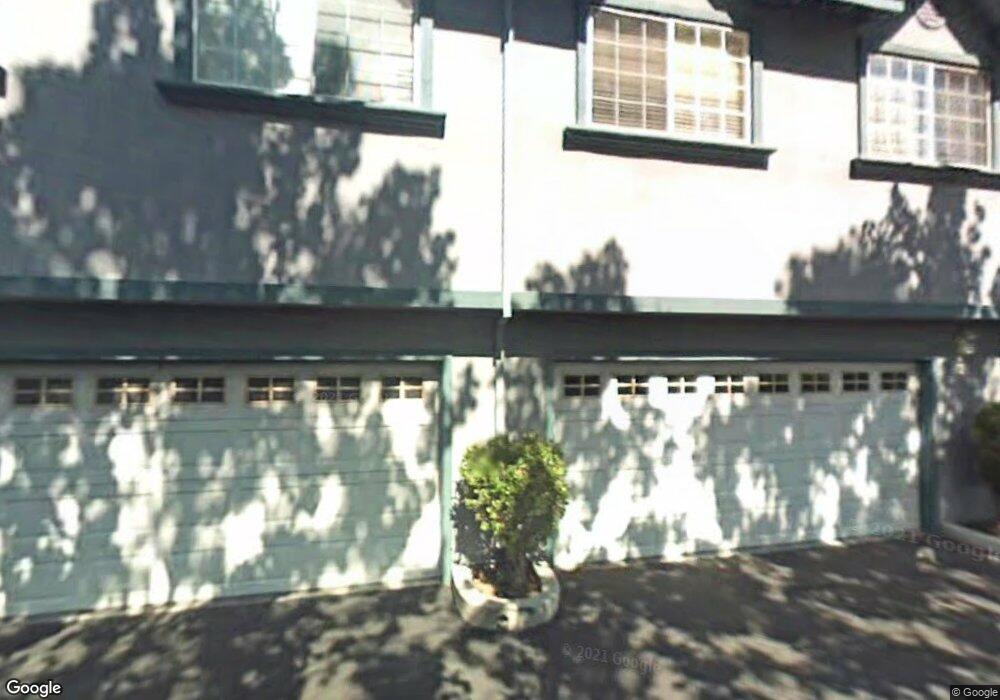
823 Creekside Place Santa Clara, CA 95051
Estimated Value: $853,000 - $1,319,000
2
Beds
3
Baths
1,235
Sq Ft
$872/Sq Ft
Est. Value
About This Home
This home is located at 823 Creekside Place, Santa Clara, CA 95051 and is currently estimated at $1,076,886, approximately $871 per square foot. 823 Creekside Place is a home located in Santa Clara County with nearby schools including Central Park Elementary, Juan Cabrillo Middle School, and Santa Clara High School.
Ownership History
Date
Name
Owned For
Owner Type
Purchase Details
Closed on
Apr 23, 1998
Sold by
Gilmore Edward R and Gilmore Suzanne M
Bought by
Mccarthy Kevin J
Current Estimated Value
Purchase Details
Closed on
Nov 26, 1997
Sold by
Gilmore Suzanne M and Marie Suzanne
Bought by
Hooper Suzanne Marie
Home Financials for this Owner
Home Financials are based on the most recent Mortgage that was taken out on this home.
Original Mortgage
$220,000
Interest Rate
7.31%
Purchase Details
Closed on
Aug 25, 1995
Sold by
Gilmore Edward R and Gilmore Suzanne M
Bought by
Gilmore Suzanne Marie
Purchase Details
Closed on
Apr 15, 1994
Sold by
Sloan David A
Bought by
Gilmore Edward Robert and Gilmore Suzanne Marie
Home Financials for this Owner
Home Financials are based on the most recent Mortgage that was taken out on this home.
Original Mortgage
$179,160
Interest Rate
3.87%
Create a Home Valuation Report for This Property
The Home Valuation Report is an in-depth analysis detailing your home's value as well as a comparison with similar homes in the area
Home Values in the Area
Average Home Value in this Area
Purchase History
| Date | Buyer | Sale Price | Title Company |
|---|---|---|---|
| Mccarthy Kevin J | -- | -- | |
| Hooper Suzanne Marie | -- | Old Republic Title Company | |
| Gilmore Suzanne Marie | -- | -- | |
| Gilmore Suzanne Marie | -- | -- | |
| Gilmore Edward Robert | $224,000 | First American Title Guarant |
Source: Public Records
Mortgage History
| Date | Status | Borrower | Loan Amount |
|---|---|---|---|
| Previous Owner | Hooper Suzanne Marie | $220,000 | |
| Previous Owner | Gilmore Edward Robert | $179,160 | |
| Closed | Gilmore Edward Robert | $33,592 |
Source: Public Records
Tax History Compared to Growth
Tax History
| Year | Tax Paid | Tax Assessment Tax Assessment Total Assessment is a certain percentage of the fair market value that is determined by local assessors to be the total taxable value of land and additions on the property. | Land | Improvement |
|---|---|---|---|---|
| 2025 | $4,486 | $385,089 | $139,875 | $245,214 |
| 2024 | $4,486 | $377,539 | $137,133 | $240,406 |
| 2023 | $4,441 | $370,138 | $134,445 | $235,693 |
| 2022 | $4,371 | $362,881 | $131,809 | $231,072 |
| 2021 | $4,354 | $355,767 | $129,225 | $226,542 |
| 2020 | $4,275 | $352,120 | $127,900 | $224,220 |
| 2019 | $4,271 | $345,217 | $125,393 | $219,824 |
| 2018 | $3,999 | $338,449 | $122,935 | $215,514 |
| 2017 | $3,980 | $331,814 | $120,525 | $211,289 |
| 2016 | $3,938 | $325,309 | $118,162 | $207,147 |
| 2015 | $3,923 | $320,424 | $116,388 | $204,036 |
| 2014 | $3,720 | $314,149 | $114,109 | $200,040 |
Source: Public Records
Map
Nearby Homes
- 775 Fairlane Ave
- 2971 Salem Dr
- 960 Kiely Blvd Unit F
- 940 Kiely Blvd Unit H
- 954 Kiely Blvd Unit H
- 680 Hamilton Ln
- 3033 Kaiser Dr Unit H
- 695 Cupples Ct
- 834 Quince Ave Unit 37
- 840 Quince Ave Unit 27
- 2805 Sykes Ct
- 836 Pomeroy Ave Unit 70
- 2683 Sonoma Place
- 2782 Sonoma Place
- 2421 Karen Dr
- 1101 Pomeroy Ave
- 2475 Karen Dr
- 2530 Forbes Ave
- 584 Valeri Ruth Ct
- 2487 Rebecca Lynn Way
- 821 Creekside Place
- 825 Creekside Place
- 827 Creekside Place
- 819 Creekside Place
- 817 Creekside Place
- 815 Creekside Place
- 813 Creekside Place
- 823 Woodhams Oaks Place
- 827 Woodhams Oaks Place
- 811 Creekside Place
- 821 Woodhams Oaks Place
- 809 Creekside Place
- 817 Woodhams Oaks Place
- 831 Woodhams Oaks Place
- 807 Creekside Place
- 813 Woodhams Oaks Place
- 835 Woodhams Oaks Place
- 2900 Miles Dr
- 805 Creekside Place
- 2912 Miles Dr