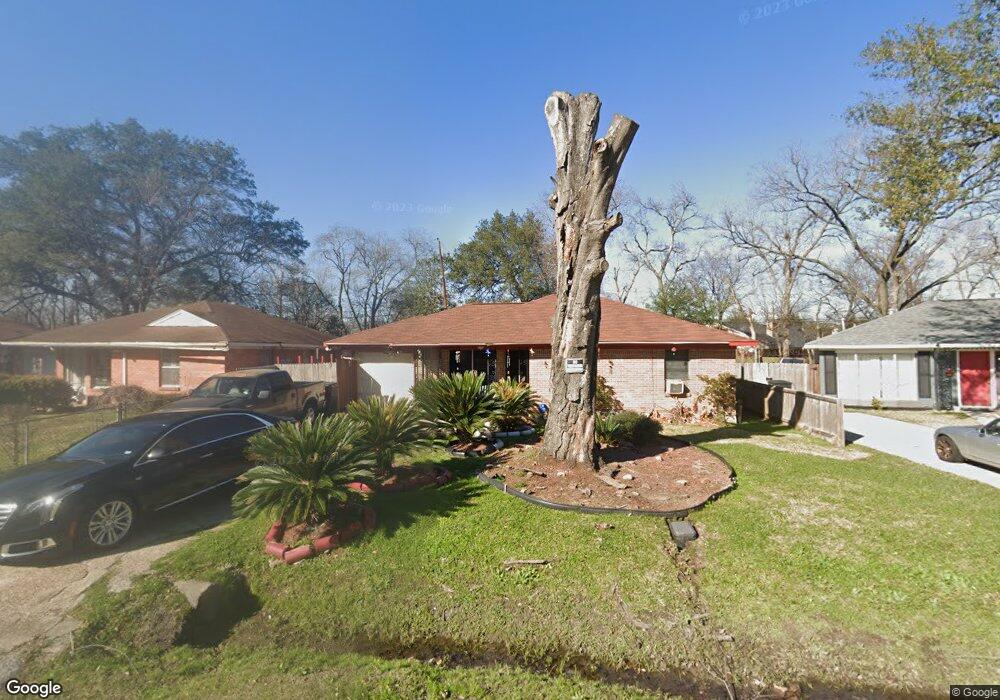
823 E 43rd St Houston, TX 77022
Independence Heights NeighborhoodEstimated Value: $183,000 - $225,760
2
Beds
1
Bath
926
Sq Ft
$214/Sq Ft
Est. Value
About This Home
This home is located at 823 E 43rd St, Houston, TX 77022 and is currently estimated at $198,190, approximately $214 per square foot. 823 E 43rd St is a home located in Harris County with nearby schools including Burrus Elementary School, Williams Middle, and Booker T Washington Sr High.
Ownership History
Date
Name
Owned For
Owner Type
Purchase Details
Closed on
Mar 4, 2008
Sold by
Jabe Resources Llc
Bought by
Neal Chester W and Neal Melina K
Current Estimated Value
Home Financials for this Owner
Home Financials are based on the most recent Mortgage that was taken out on this home.
Original Mortgage
$45,000
Interest Rate
4.97%
Mortgage Type
Seller Take Back
Purchase Details
Closed on
Dec 4, 2007
Sold by
David Patrenia Mae and Jones Ronnie Ebb
Bought by
Jabe Resources
Create a Home Valuation Report for This Property
The Home Valuation Report is an in-depth analysis detailing your home's value as well as a comparison with similar homes in the area
Home Values in the Area
Average Home Value in this Area
Purchase History
| Date | Buyer | Sale Price | Title Company |
|---|---|---|---|
| Neal Chester W | -- | None Available | |
| Jabe Resources | $5,010 | None Available |
Source: Public Records
Mortgage History
| Date | Status | Borrower | Loan Amount |
|---|---|---|---|
| Closed | Neal Chester W | $45,000 |
Source: Public Records
Tax History Compared to Growth
Tax History
| Year | Tax Paid | Tax Assessment Tax Assessment Total Assessment is a certain percentage of the fair market value that is determined by local assessors to be the total taxable value of land and additions on the property. | Land | Improvement |
|---|---|---|---|---|
| 2025 | $23 | $220,251 | $167,738 | $52,513 |
| 2024 | $23 | $217,674 | $167,738 | $49,936 |
| 2023 | $23 | $189,224 | $149,100 | $40,124 |
| 2022 | $2,676 | $190,080 | $149,100 | $40,980 |
| 2021 | $2,575 | $156,496 | $118,038 | $38,458 |
| 2020 | $2,432 | $146,535 | $111,825 | $34,710 |
| 2019 | $2,310 | $104,507 | $55,913 | $48,594 |
| 2018 | $1,387 | $102,696 | $55,913 | $46,783 |
| 2017 | $1,908 | $84,058 | $37,275 | $46,783 |
| 2016 | $1,735 | $68,597 | $24,850 | $43,747 |
| 2015 | $1,115 | $68,597 | $24,850 | $43,747 |
| 2014 | $1,115 | $62,634 | $17,084 | $45,550 |
Source: Public Records
Map
Nearby Homes
- 4109 Castor St Unit B
- 821 Neyland St
- 4028 Cornell St
- 4208 Castor St Unit B
- 4208 Castor St Unit A
- 749 E 41st St
- 4043 Europa St
- 821 Barkley St
- 719 E 40th 1/2 St
- 727 E 40th St
- 606 E 42nd St
- 819 E 40th St Unit A/B
- 707 E 40th 1/2 St
- 4208 Europa St
- 4220 Delhi St
- 610 E 41st St Unit A B
- 4303 Castor St
- 4211 Rogers St
- 4303 Castor Na St
- 716 E 40th St